Download
1 / 23

E N D
Extracts from a presentation to Governors in July 2012 on the schools’ results for the academic year 2011-12which show improvements in results:Above National scores for the End of the Early Years FoundationResults in line with National at the end of KS1 for reading and mathsA significant closing of the gap with National results at the end of KS2
“In the Early Years Foundation Stage, children learn to work independently, concentrate, make choices and think through their ideas.”Ofsted July 2012
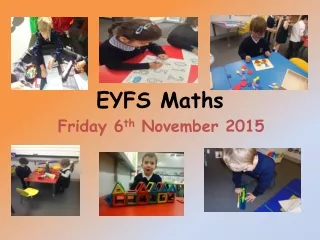
The following slide shows our results for 2012 for the end of Reception year.For each of the 13 areas of the Early Years curriculum the average points per child per area are shown for October 2011, March 2012 and July 2012These are compared to the National figures for the end of 2011.
“Pupils progress is improving. Pupils from all years are catching up lost ground.”Ofsted July 2012In July 2012 at the end of KS1 the school achieved results in line with National for Reading and Maths and closed the gap in Writing
KS1 Reading Results 2012(20 children: 1 child = 5%)(% of children on SEN school action plus or statemented = 33%)
“Year 2 pupils read with confidence and understanding, showing accurate knowledge of phonics.”“Overall, reading is a relative strength throughout the school.”Ofsted July 2012
KS1 Writing Results 2012(20 children: 1 child = 5%)(% of children on SEN school action plus or statemented = 33%)
KS1 Maths Results 2012(20 children: 1 child = 5%)(% of children on SEN school action plus or statemented = 33%)
“Pupils progress is improving. Pupils from all years are catching up lost ground.”Ofsted July 2012In July 2012 the school closed the gaps with National results in Reading, Writing and Maths
KS2 English (2012 class size 24: one child = 4%)(2012 % SEN at School Action Plus or above = 42%)
KS2 Writing (2012 class size 24:one child = 4%)(2012 % SEN at School Action Plus or above = 42%)
KS2 Reading (2012 class size 24:one child = 4%)(2012 % SEN at School Action Plus or above = 42%)
KS2 Mathematics(2012 class size 24:one child = 4%)(2012 % SEN at School Action Plus or above = 42%)
KS2 English and Maths2012 class size 24:one child = 4%)(2012 % SEN at School Action Plus or above = 42%)
“Those identified as having special educational needs achieve as well as others.”Ofsted July 2012
“Year 6 pupils are very well prepared for moving to secondary school , through a sensitive transition process”Ofsted July 2012
Further information: For the Department of Education information on the school please use the following link: http://www.education.gov.uk/cgi-bin/schools/performance/school.pl?urn=125031