Download
1 / 20
210 likes | 789 Views
Colorado Regulation 7. LDAR Monitoring Frequency and Cost Control. Facebook status update: In NOLA!. Why did I have that last Hurricane?. Choose Your Own Adventure!. Beer: Colorado has more microbreweries per capita than any other state! South Park: Is it Real?

E N D
Colorado Regulation 7 LDAR Monitoring Frequency and Cost Control
Facebook status update: In NOLA! Why did I have that last Hurricane?
Choose Your Own Adventure! • Beer: Colorado has more microbreweries per capita than any other state! • South Park: Is it Real? • Recreation: Snowpack was 31% higher than the 30-year average. • Oil and Gas: First-in-the-nation to limit methane emissions. • Football: Was that an Epic Meltdown or What? Can the Broncos fix their issues?
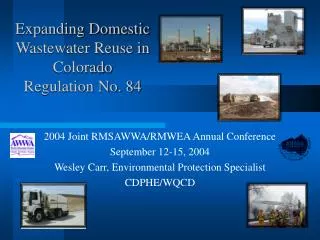
Colorado First State to Limit Methane Pollution from Oil and Gas Wells ~Scientific American Colorado First State to Clamp Down on Fracking Methane Pollution ~Bloomburg Colorado First State to Clamp Down on Fracking Methane Pollution ~Denver Post Colorado Becomes First State To Restrict Methane Emissions ~NPR Colorado seeks to regulate methane emissions ~Washington Post
Outline…. • Background • The Story • Methodology • Results • Costs • Discussion
The Background… • Approved on February 23, 2014, effective on April 14, 2014. • Applies from wellhead to the inlet of a gas processing plant • Leak detection primarily targets piping, tanks, and compressors
Skip Period Monitoring…. • Accepted work practice • LDAR • National Uniform Emission Standards • Refinery Consent Decrees
DJ Basin Piceance
The Story…… • Evaluate the leak frequencies at facilities under LDAR programs. • Explore the impact of the emission calculations and the absence of skip-period monitoring.
Study Methodology… Inlet Compressor • 14 Natural Gas Processing Plants • Inlet Processing Units • NTM - Valves Slug Receiver Inlet Meter Glycol Dehydrator
CASE STUDY 1 – 8 Facilities with Initial LDAR Programs. Study Length: 1 year. CASE STUDY 2 – 6 Facilities with Established LDAR Programs. Study Length: 3 years
Results: Case Study 1 Number of Inspections Completed Number of Components Inspected Components Inspections Time Time
Results: Case Study 1 Average Percent of New Leaks Found Number of New Leaks Found Percent (%) Leaks Time Time
Results: Case Study 2 Number of Inspections Completed Number of New Leaks Found Leaks Inspections Time Time
Results: Case Study 2 Average Percent of New leaks/Number of Inspections Percent (%) Time
Results: Final Thoughts Point X (Initial Leak Frequency) Point F (Final Leak Frequency) Fraction Leaking Monitoring Cycle Figure 5-35, EPA-453/R-95-017
“I am not one of those who in expressing opinions confine themselves to facts.” ~ Mark Twain
Discussion… • LDAR + good work practices = low leak frequency. • Low-leak frequency is sustainabile • Emission factors are overly conservative • No incentives for operators
Jane Steere jsteere.@trihydro.com 307.745.7474 Meredith Knauf mknauf@trihydro.com 307.745.7474