Download

1 / 13
130 likes | 136 Views
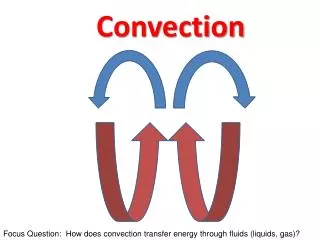
Potential for Convection. Lifted Index. Lifted Index. Compares theoretical lifted temperature of surface air to actual temperature of upper air If (lifted temperature) > (upper-air temperature), parcel unstably rises. Lifted Index. LI = ( upper-air temp )−( lifted air temp ) Meanings

E N D
Potential for Convection Lifted Index
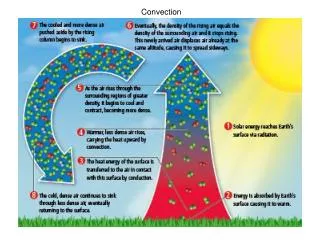
Lifted Index • Compares theoretical lifted temperature of surface air to actual temperature of upper air • If (lifted temperature) > (upper-air temperature), parcel unstably rises
Lifted Index • LI = (upper-air temp)−(lifted air temp) • Meanings > 0: stable air; no thunderstorms 0 to −2: possible thunderstorms with lifting mechanism −2 to −6: thunderstorms likely, possibly severe < −6: severe thunderstorms likely
Determine a L.I.! Educational! Easy! • “Lift” parcel, cool at dry lapse rate until saturated • Continue to “lift,” but at saturated lapse rate (slower T drop) • Compare to actual air temp at 500 mbar Fun!
Making a Stüve Plot Potential for convective storms
Thermodynamic Plot • Solid slanted lines (dry adiabats) show “lapse rate:” temperature drop with elevation gain • If you know surface T,p you know it for the rising parcel
Thermodynamic Plot • Rising moisture-saturated air condenses • Releases heat • Temperature drop is inhibited • Slanted dashed curves: saturated adiabats
Thermodynamic Plot • Mixing ratio: (mass of water vapor)/(mass of air) (g/kg) • Dotted lines: saturation mixing ratios • Dew point T, p at that mixing ratio
Lifting a Surface Parcel • Air rises, expands, and cools along a dry adiabat… • Until it reaches its dew point • Then rises and cools along a saturated adiabat
Finding the Dew Point • Lift along mixing ratio until it meets the dry adiabat • That is when the moisture begins to condense
Lifting a Surface Parcel • Lift along the dry adiabat and the saturation mixing ratio until they meet • Then lift along the saturated adiabat
Lifted Index • Lift surface air along dry adiabat until saturation • Then lift along saturated adiabat to 500 mb • Lifted index = (air temp at 500 mb) – (lifted parcel temp at 500 mb) • Best chance of severe thunderstorms when L.I. < –6 °C
Task • Plot the temperatures and dew points • Lift the surface parcel to 500 mb pressure • Determine the lifted index