Download
1 / 1
10 likes | 96 Views
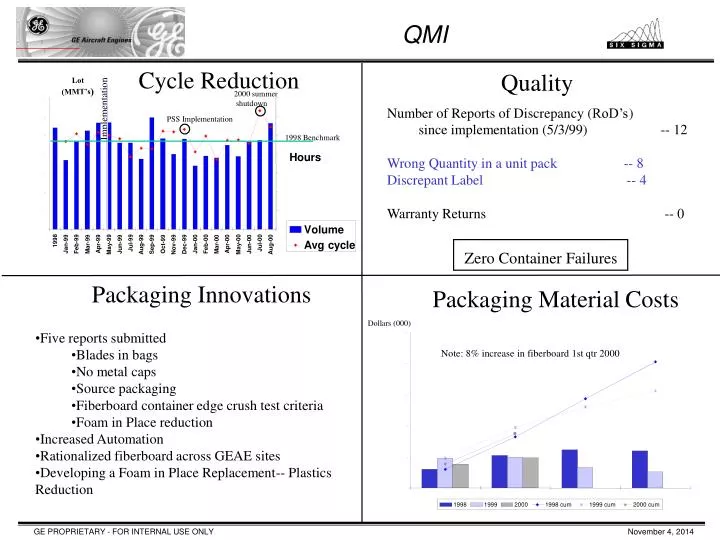
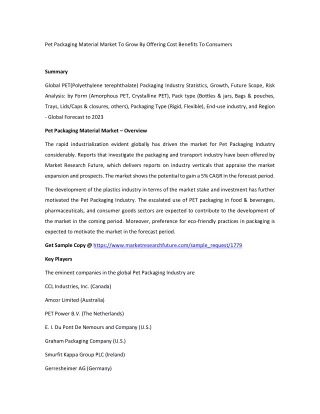
140. 7000. 120. 6000. 100. 5000. Hours. 80. 4000. 60. 3000. 40. 2000. 20. 1000. Volume. 0. 0. 1998. Jul-99. Jul-00. Jan-99. Jan-00. Apr-99. Apr-00. Feb-99. Mar-99. Jun-99. Feb-00. Mar-00. Jun-00. May-99. Sep-99. Oct-99. Dec-99. May-00. Aug-99. Aug-00. Nov-99.

E N D
140 7000 120 6000 100 5000 Hours 80 4000 60 3000 40 2000 20 1000 Volume 0 0 1998 Jul-99 Jul-00 Jan-99 Jan-00 Apr-99 Apr-00 Feb-99 Mar-99 Jun-99 Feb-00 Mar-00 Jun-00 May-99 Sep-99 Oct-99 Dec-99 May-00 Aug-99 Aug-00 Nov-99 Avg cycle 2500 2000 1500 1000 500 0 1998 1999 2000 1998 cum 1999 cum 2000 cum QMI Cycle Reduction Quality Lot ) (MMT’s 2000 summer Implementation shutdown Number of Reports of Discrepancy ( RoD’s ) PSS Implementation since implementation (5/3/99) -- 12 1998 Benchmark Wrong Quantity in a unit pack -- 8 Discrepant Label -- 4 Warranty Returns -- 0 Zero Container Failures Packaging Innovations Packaging Material Costs Dollars (000) • Five reports submitted • Blades in bags Note: 8% increase in fiberboard 1st qtr 2000 • No metal caps • Source packaging • Fiberboard container edge crush test criteria • Foam in Place reduction • Increased Automation • Rationalized fiberboard across GEAE sites • Developing a Foam in Place Replacement-- Plastics Reduction


![Stand Up Pouch Packaging Material 0819.1144.2624[wa]](https://cdn5.slideserve.com/9831781/stand-up-pouch-packaging-material-08i9-ii44-2624-dt.jpg)