Download
1 / 48
500 likes | 625 Views
Lake metabolism modeling from sensor network data Pan-American Sensors for Environmental Observatories (PASEO), 2009, Bahia Blanca, Argentina Paul Hanson, Tim Kratz, and Luke Winslow University of Wisconsin, Center for Limnology. Support provided by Mellon Foundation

E N D
Lake metabolism modeling from sensor network data Pan-American Sensors for Environmental Observatories (PASEO), 2009, Bahia Blanca, Argentina Paul Hanson, Tim Kratz, and Luke Winslow University of Wisconsin, Center for Limnology Support provided by Mellon Foundation Gordon & Betty Moore Foundation
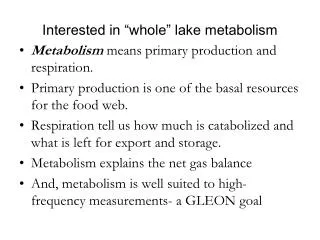
“A skilled limnologist can probably learn more about the nature of a lake from a series of oxygen determinations than from any other kind of chemical data.” G. Evelyn Hutchinson (1957)
Dissolved gases, through their observable changes through time, allow us to understand what cannot be seen – the way lakes work.
In ecosystems, the connections are not obvious or even observable, and they are physical, chemical, and biological in nature. P = physical process C = chemical process B = biological process S = state variable Observable veneer S C C B P B The way things work C B P P
Is it a population to be sampled? Dynamic through space and time? Are relationships empirical or mechanistic? Models Observations What can be observed? What spatio-temporal scale? Do we intervene or control? What are the process rates? What’s the importance to the larger story? Theory
Outline • Dissolved gas basics • The simple approach to calculating lake metabolism • In truth, it’s complicated
Lake Taihu, China Rotorua L., New Zealand Dissolved oxygen (mg L-1) Sparkling L., U.S.A. Ormajarvi, Finland Trout Bog, U.S.A. Day 1 Day 2
Lake Taihu, China Rotorua L., New Zealand R GPP +R Dissolved oxygen (mg L-1) Sparkling L., U.S.A. Ormajarvi, Finland Trout Bog, U.S.A. Day 1 Day 2
Examples of dissolved oxygen saturation over 10 days (obtained from GLEON, using VaDER) Lake Mendota Dissolved Oxygen (% sat) Sparkling Lake Crystal Bog Lake Date in 2008
3.2 Solubility Dissolved Gases in Fresh Water atmosphere water concentration in water Henry’s* constant (25°C) x = partial pressure O2 CO2 210,000 µatm x 1.26 x10-3 = 265 µmol L-1 (~8.5 mg L-1) = 13 µmol L-1(~0.6 mg L-1) 370 µatm x 3.39 x10⁻² *Henry’s constant (mol atm-1) is a function of temperature and salinity
3.1 Units of measure Common units of O2 and CO2 common gas pressure units: 1 atmosphere = 1013 millibars = 101 kilopascals common dissolved gas units (concentration): O2 (DO): 1 mg L-1 x (32 mg mmol-1)-1 x 1000 µmol mmol-1 = 31.3 µmol L-1 CO2: 1 mg L-1x (44 mg mmol-1)-1 x 1000 µmol mmol-1 = 22.7 µmol L-1 common dissolved gas units (areal): g m-2
Saturation Gas Concentrations (in equilibrium with the atmosphere) 19.2 0.36 supersaturation undersaturation 12.8 0.24 CO2 (mg L-1) DO (mg L-1) supersaturation undersaturation CO2 saturation DO saturation 6.4 0.12 Temperature (°C)
Photosynthesis Photosynthesis and Respiration 6CO2 + 6H2O C6H12O6 + 6O2 O2 Carbs Carbs Photosynthesis: in the presence of light Respiration: all the time CO2
atmosphere water DO < 100% saturated GPP < R (i.e., -NEP)
atmosphere water DO > 100% saturated GPP < R (i.e., -NEP)
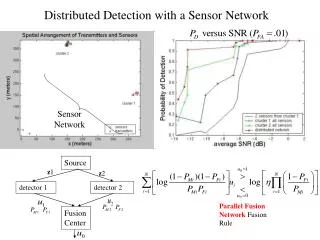
Modeling metabolism: the simple approach • A free-water approach • Mass balance equation • Many simplifying assumptions • Minimal data requirements
Ecosystem respiration Gross primary production dO2/dt = GPP – R + F + A Atmospheric exchange Observed oxygen data from sensors All other fluxes, e.g., loads, exports, transfer between thermal strata Odum, H. T. 1956. Primary production in flowing waters. Limnol. Oceanogr. 1: 103-117.
dO2/dt = GPP – R + F + A (Odum 1956) Nighttime R = – dO2/dt+ F + GPP + A Daytime GPP = dO2/dt+R – F + A From night time NEP = GPP– R Odum, H. T. 1956. Primary production in flowing waters. Limnol. Oceanogr. 1: 103-117.
Why add F? Imagine placing a barrier over the lake to prevent atmospheric exchange. The change in oxygen, driven exclusively by R, would look more like the red line. R = – dO2/dt+ F + GPP + A
Why add R? If R were somehow turned off, the increase in DO would have been greater. Why subtract F? Imagine the barrier again… F artificially increases GPP by driving DO toward saturation GPP = dO2/dt+R – F + A
F(mg/L/d) = k(m/d) * ( DOsat(mg/L) – DOobs(mg/L)) / z (m) k = f(wind speed, water temperature) atmosphere water k = piston velocity, or the depth equilibrated per day (e.g., 0.5 m/d) z = mixed layer depth (e.g., 2 m) epilimnion
Data requirements for the simple model (sampled at least hourly) 4. Wind speed or 0.45 (atmospheric exchange) 5. Barometric pressure or altitude (gas solubility) atmosphere water 1. Dissolved oxygen 2. Water temperature (gas solubility) 3. Mixed layer depth (atmospheric exchange) epilimnion
Examples of surface water metabolism rates from 25 lakes in northern Wisconsin 80 1 mg L-1 d-1 Hanson, P.C., Bade, D. L., Carpenter, S. R., and T. K. Kratz. 2003. Lake metabolism: Relationships with dissolved organic carbon and phosphorus. Limnol. Oceanogr. 48: 1112-1119.
Metabolism Recipe (simple) • RTS for each time step (TS) at night… • Calculate FTS using difference equation and Cole and Coraco (1998) • RTS is the (-) change in DO plus (+) the F • GPPTS for each time step during day light… • Calculate FTS using difference equation and Cole and Coraco (1998) • GPPTS is the (+) change in DO plus (+) R24 minus (-) FTS • R24 = some integration of RTS over 24 hours • GPP24 = some integration of GPPTS during daylight hours • F24 = some integration of FTS over 24 hours Cole, J. J., and N. F. Caraco. 1998. Atmospheric exchange of carbon dioxide in a low-wind oligotrophic lake measured by the addition of SF6. Limnol. Oceanogr. 43: 647-656.
Issues and Assumptions • Model • Atmospheric exchange (F) model • Buoy measurements representative of the ecosystem • Biological model underlying GPP and R • A, or everything that’s not F, GPP, or R • Calculation of the simple model • Integration from GPPTS and RTS to GPP24 and R24 • Availability of wind speed, barometric pressure, mixed layer depth • Daytime R = Nighttime R
Issue Below wind speeds of about 3 ms-1, there is high uncertainty in the estimate of k. This is a problem for most small lakes. (From: Cole and Caraco 1998) Cole, J. J., and N. F. Caraco. 1998. Atmospheric exchange of carbon dioxide in a low-wind oligotrophic lake measured by the addition of SF6. Limnol. Oceanogr. 43: 647-656.
12 11 10 (a) 9 8 7 Dissolved Oxygen (mgL 0 14 (b) 13 12 11 10 9 8 Day Night Day Night 0 6 12 18 24 32 36 42 Elapsed time (hours) Issue Different habitats within the lake have different metabolic rates, and sometimes this can be very important. Low macrophyte density High macrophyte density Dissolved oxygen (mg L-1) littoral pelagic Lauster, G. H., P. C. Hanson, and T.K. Kratz. 2006. Gross primary production and respiration differences among littoral and pelagic habitats in North Temperate lakes. Canadian Journal of Fisheries and Aquatic Sciences. 63(5): 1130-1141.
temperature deposition irradiance surface water loads Atm exchange littoral-pelagic exchange PP R ground water loads photo-oxidation Internal waves strata/sediment exchange factors affecting DO measurements anaerobic respiration Figure 2
dO2/dt = GPP – R + F + A+ E Issue If we eliminate A and E from the equation and we assume we know F, then all real processes in A and E are subsumed by GPP and R. Stylized frequency distribution of R estimates from one week of DO data Negative R not biologically possible Some modes clearly represent non-biological processes f 0 +
How complicated does the biological model need to be? Examples of added complexity: • GPP could be a linear or non-linear function of irradiance • R daytime could be a function of irradiance • Photo history of algae could affect their GPP or R
Hanson, P.C., S.R. Carpenter, N. Kimura, C. Wu, S.P. Cornelius, and T.K. Kratz. 2008. Evaluation of metabolism models for free-water dissolved oxygen methods in lakes. Limnol. Oceanagr. Methods. 6:454-465.
Simple model Complicated model(s) Pmax IP Gross Primary Productivity, Respiration IR R0 P0 0 0 Irradiance Figure X. Responses for ecosystem GPP and R as a function of irradiance. Parameters are per Table X. (From Hanson et al. 2008) Hanson, P.C., S.R. Carpenter, N. Kimura, C. Wu, S.P. Cornelius, and T.K. Kratz. 2008. Evaluation of metabolism models for free-water dissolved oxygen methods in lakes. Limnol. Oceanagr. Methods. 6:454-465.
I original Beta = 4 Beta = 6 Beta = 8 PAR (µmol m-2 s-1) Day of year Hanson et al. 2008
Table 3 From the Word document Hanson et al. 2008
With metabolism model prediction, much variance remains unexplained A) Crystal Bog Dissolved oxygen (mg L-1) B) Trout Lake Observation M 1 M 2 M 3 M 4 M 5 Day of year GraphResults.m Hanson et al. 2008
Crystal Bog Lake DO T (°C) DO (mg L-1) T x 10-3 Stability (m-1) Depth (m) A) Crystal Bog Lake x 10-4 Stability (m-1) Depth (m) B) Trout Lake 234 235 236 237 Day of year Hanson et al. 2008
What are the other controls over DO at short (minutes-days) time scales?
Sparkling Lake (2004) Temp. Wind I Z Buoyancy frequency DO Day of year (total of 50 days)
Sparkling Lake Dissolved Oxygen Signal per scale Details per scale Time scale Time scale Time Time
Wavelet transforms Wavelet transforms DO Buoyancy Frequency Time Time Neural networks
For 20 lakes, DO correspondence with… Irradiance Langman, O.C., P.C. Hanson, S.R. Carpenter, K. Chiu, and Y.H. Hu. In review. Control of dissolved oxygen in northern temperate lakes over scales ranging from minutes to days. Aquatic Biology.
For 20 lakes, DO correspondence with… Temperature Langman et al. in review
For 20 lakes, DO correspondence with… Wind Speed Langman et al. in review
So environmental data are noisy! How often and for how long do you need to measure DO to be confident in the metabolism estimate?
Sparkling Lake Trout Bog Lake Little Arbor Vitae Lake B C A observed saturation DO (mg L-1) Day of year Day of year Day of year E F D GPP, R, NEP (mg L-1d-1) G H I GPP R NEP Fatm Required duration (days) Sampling period (hours) Sampling period (hours) Sampling period (hours) Figure X. Dissolved oxygen time series (A-C, note differing y axis scales), metabolism (D-F, note differing y axis scales), and required sample duration (G-I) in three study lakes (columns). Metabolism values are means calculated at different sampling periods. Required sample duration is the number of days required to sample at the specified sampling period to detect metabolism within 20% of the mean with a power of 80%. Staehr et al. In process
Summary • Environmental data are noisy • A simple metabolism model can work • Data requirements are minimal • Metabolism field is changing rapidly