Download
1 / 31
310 likes | 382 Views
Motion-Study 1D Kinematics B E Mays –S Caesar. 1D Kinematics Motion Graphs. Motion & Graphs. Motion graphs are an important tool used to show the relationships between position, speed, and time. It’s an easy way to see how speed or position changes over time

E N D
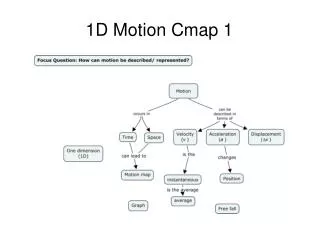
Motion & Graphs • Motion graphs are an important tool used to show the relationships between position, speed, and time. • It’s an easy way to see how speed or position changes over time • These types of graphs are called kinematic graphs. • There are two types: • Position vs. Timegraphs • Speed vs. TimeGraphs
Position Vs. Time • Used to show an object’s position at a given time. • Position: on y-axis • Time: on x-axis
Try It: Graphing Position Vs. Time • Suppose you are helping a friend who is training for a track meet. • She wants to know if she is running at constant speed. • You mark the track in 50-meter increments and measure her time at each position during a practice run. • Create a position-time graph using her data.
You can do: Graphing Position Vs. Time • When you’ve plotted all 4 points, you should get a graph that looks like this… • What would her speed be? • Choose any point, & divide distance (position) over time
PLOT it: Graphing Position Vs. Time • What would her speed be? • 50m/10s = 5 m/s • 100m/20s = 5 m/s • Notice that this is a straight line - why?? • She is moving at a constant speed - neither slowing down nor accelerating
Graphing Position Vs. Time Lab#2 • Graph the points: (0,0), (1, 10), (2, 20), (3, 30), (4, 40), (5, 50). • Draw a chart of positon and time for the above pictorial diagram • What is the velocity of the car? Is it constant?
Position verses Time • Graph the motion of the chart in the previous slide. • Your graph should look like this… • Your graph should look like this…
What does slope have to do with it? • Slope is the ratio of the rise (y-axis) to the run (x-axis) of a line on a graph. • A bigger value of the slope means a steeper line which means a faster speed.
Let us consider two different cars (red & blue) moving at different speed in the same direction. Going rightwards here is considered as apositive direction. • Study the slopes of these cars Steeper Line = Faster Speed
Negative Slopes • What does this graph mean??? • What does the negative slope indicate? • They show an object that is moving in opposite direction with constant speed . • The first graph indicates that the car has smaller constant speed, while in the second graph the object has higher constant speed in negative direction. Comparing the slopes , the 2nd graph has steeper slope
Basically… You might want to study thisgraph in your next lessons which are velocity –time graphs. The slopes of v-t graphs indicate acceleration of an object.
. Distance, Velocity & Acceleration • Now consider a car that has a changing velocity. • It is not moving at a constant rate, but getting faster by the second. • Please create a chart of position and time, for such a car. • Also draw the pictorial diagram for the car moving this way.
Position Vs. Time - Changing Velocity • What would this graph look like? • You try it first…
Does your graph look like this? Be sure you have this one drawn in your lab book
Try It: GrAPHINGPosition Vs. Time #3 • What would the graph look like for a car that traveled 10 m in the 1st second, 15 m by the 2nd second, 25 by the 3rd second, and 40 m by the 4th second?
This graph is for a car moving with a constant velocity of +5 m/s for 5 seconds, stopping abruptly, and then remaining at rest for 5 seconds. • The straight line means its position is NOT changing.
Speed Vs. Time • Used to show an object’s speed at a given time. • Speed: on y-axis • Time: on x-axis
Speed Vs. Time - Constant Speed • This graph shows the speed versus time for a ball rolling at constant speed on a level floor. • On a speed vs. time graph, constant speed is shown with a straighthorizontal line parallel to x-axis. • Draw a pictorial diagram and create a chart for speed – time. Try plotting it on a speed –time graph.Study the plotted graph. • If you look at the speed on the y-axis, you see that the ball is moving at 1 m/s for the entire 10 seconds.
Speed Vs. Time - Constant Speed • Compare this speed-time graph to the position-time graph for the ball. • Both of the graphs show the exact same motion, even though they look different. • If you calculate the slope of the lower graph, you will find that it is still 1 m/s. • ( in class demo done)
Graphing Speed Vs. Time • Maria walks at a constant speed of 6 m/s for 5 seconds. • Then, she runs at a constant speed of 10 m/s for 5 seconds. • Create a speed-time graph using her data.
Speed Vs. Time - Changing Speed • As we know, most objects don’t move at a constant speed. • If a speed vs. time graph slopes up, then the speed is increasing. Has an acceleration. • If it slopes down ( steeper negative slope), then the car speeds up at constant rate in negative direction. It indicates that the car has higher constant acceleration. • REMEMBER: The speed –time slope indicates acceleration. Its SI unit is meter/second square
Speed Vs. Time - Changing Speed • It is decreasing at a constant rate, if the slope of speed-time graph is shallower. • If the graph is horizontal, then the object is moving at a constant speed. • YOU MAY WANT TO DRAW THESE GRAPHS TOO!
Summing it All TogetherChech your understanding • Which runner won the race? • Albert won the race. He reached 100 meters first. • Which runner stopped for a rest? • Charlie stopped for a rest at 50m. • How long did he stop for? • Charlie stopped for 5 seconds. (13-8)
summing it All Together 4. How long did Bob take to complete the race? • Bob finished the race in 14 seconds 5. Calculate Albert's average speed. • Speed = distance/time • Speed = 100m/12s = • Albert’s Speed = 8.3 m/s