Download
1 / 22
220 likes | 349 Views
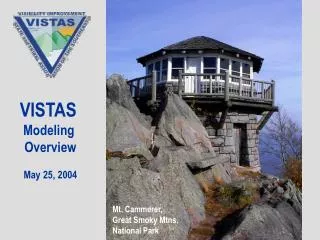
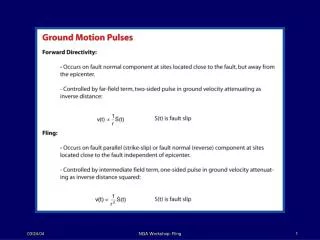
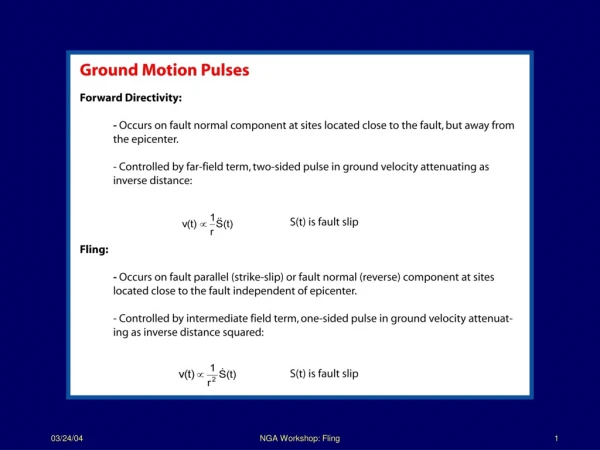
VISTAS Modeling Overview Nov 4, 2003. VISTAS is evaluating visibility and sources of fine particulate mass in the Southeastern US. View NE from Appalachian Trail, Mt. Cammerer, Great Smoky Mtns. VISTAS - Regional Haze Timeline. PM 2.5 Designation Mar 2004. PM 2.5 & Haze SIPs

E N D
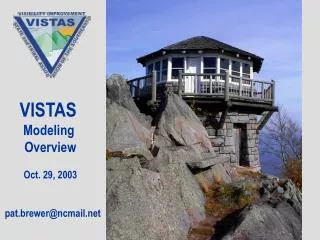
VISTAS Modeling Overview Nov 4, 2003
VISTAS is evaluating visibility and sources of fine particulate mass in the Southeastern US View NE from Appalachian Trail, Mt. Cammerer, Great Smoky Mtns.
VISTAS - Regional Haze Timeline PM2.5 Designation Mar 2004 PM2.5 & Haze SIPs Dec 2007 Regional Haze Rule 1999 2000 2001 2002 2003 2004 2005 2006 2007 2008 BART Sources VISTAS Planning Strategy Design Reasonable Progress Goals Policy Interpretation Air Quality Monitoring Baseline and natural conditions Base year and future year strategies Emissions Inventory Base year and future year air quality Atmospheric Modeling States Develop Haze SIPs
VISTAS Science Supports Regulatory Decisions Air Quality Air Quality Responses to Emission Controls • gases • particles • deposition • visibility • Atmospheric • Model: • Chemistry • Transport • Deposition Meteorology • topography Policy Interpretation Emissions • anthropogenic • biogenic
2001 Annual Average Light Extinction Mm-1 From VIEWS website
250 200 Coarse Soil 150 Organics EC 100 NH3NO3 (NH4)2SO4 Rayleigh 50 0 Light Extinction on 20% Haziest Days - IMPROVE 1998 - 2001 Extinction (Mm-1) Sipsey, AL Everglades, FL Dolly Sods, WV Okefenokee, GA Shenandoah, VA Cape Romain, SC Shining Rock, NC Swan Quarter, NC Linville Gorge, NC Mammoth Cave, KY Chassahowitzka, FL James Rvier Face, VA Great Smoky Mtns, TN
250 200 Coarse Soil 150 Organics EC NH4NO3 100 (NH4)2SO4 Rayleigh 50 0 Light extinction on 20% Haziest Days - IMPROVE (1998-2001) Extinction (Mm-1) Acadia, ME Big Bend, TX * Yosemite, CA Lye Brooke, NH Grand Canyon, AZ * Cape Romain, SC Boundary Waters, MN * Great Smoky, Mtns, TN * missing data 1-2 yrs
VISTAS Data Analyses • PM2.5 and visibility trends: IMPROVE, EPA/STN, SEARCH • 2003 report by Air Resource Specialists (www.vistas-sesarm.org/data ) • VISTAS Focus sites: • Great Smoky Mtns., TN, Cape Romain, SC, Millbrook, NC • Continuous monitoring sulfate, nitrate, carbon in addition to surface met, TEOM, every 3rd day speciated PM2.5 • Sources of primary organic carbon: Chemical Mass Balance • Gasoline, diesel, wood, vegetative detritus, not secondary carbon • Natural Background Visibility • fire, vegetative emissions, sea salt, dust • Inter-regional influences
VISTAS Emissions Inventory • Objective: provide inventories for modeling PM2.5 and regional haze • State and local agencies review and revise • 2002 – 1st draft delivered Aug 03; 2nd draft due Dec 03 • 2018 – 1st draft due Mar 04, 2nd draft Sept 04 • Improve inventories • NH3,,fire, primary carbon PM2.5 • Hourly, daily, seasonal • Spatial allocation
6 5 4 3 2 1 0 SO2 NOx VOC PM10 PM2.5 NH3 VISTAS 2002 10-StateEmissions Inventory Nonroad On-Road Million tons/year Area Industry Utility Based on state/local inventory data or 1999 NEI v2, grown to 2002
SO2 Point Sources >5,000 Tons per year 1999 National Emissions Inventory v 2 Annual SO2 emissions 250,000 125,000 25,000
VISTAS Air Quality Modeling Objectives: • Accurately represent meteorology, emissions, and air quality • MM5, SMOKE, CMAQ • Model base year to support both regional haze and PM2.5regulatory requirements • Model future year and control strategies for regional haze • states responsible for PM2.5attainment demonstrations
VISTAS Air Quality Modeling • Phase I: Evaluate different model configurations for 3 episodes: Jan 02, July 99, July 01 • recommend annual modeling protocol Jan 04 • Phase Ib: Evaluate emissions sensitivities • Decoupled Direct Method (DDM) to support design of emissions control strategies - Sept 04 • Phase II: Annual regional modeling • base year modeling begins Jan 04 • control strategy runs completed by June 05
VISTAS Modeling Contracts • Meteorological Modeling • Baron Applied Meteorological Systems • Emissions, and Air Quality Modeling • Environ International Corporation • University of California – Riverside • Alpine Geophysics • Emissions sensitivities using DDM for aerosols • Georgia Institute of Technology • Characterize Meteorology, PM2.5, visibility • Systems Applications International (ICF Consulting)
Initial CMAQ Model Configuration CMAQ Version 4.3 (August 2003) • Horizontal Advection and Vertical Advection • Piecewise Parabolic Method (PPM) • Gas-Phase Chemistry: CB-IV with MEBI/Hertel Solver • Aerosol Chemistry: AE3 / ISORROPIA / SORGAM • Aqueous-Phase Chemistry: RADM • Dry Deposition: Pleim-Xiu • MM5 Configuration: • Pleim-Xiu/ACM Soil/PBL models with MCIP2.2 Pass Through • SMOKE Emissions: NEI 1999 v2 with CMU NH3
CMAQ Sensitivity Tests: 3 episodes • Vertical Layers: 19 vs 34 layers • Boundary Conditions: Ultra Clean, GEOS-CHEM • Ammonia Emissions: Jan 50% reduction, diurnal pattern • Vertical Diffusivity - Minimum Kz: 0.1 or 1.0 m2/s • Alternative meteorology - with Wesley Dry Deposition • SAPRC-99 chemistry • CB-2002 chemistry • CB-AIMS chemistry with sectional approach • Best and Final CMAQ configuration • CAM-x trial with comparable configuration
Emissions Sensitivities Objectives • Install DDM-AERO in CMAQ • DDM gas-phase already in CMAQ • Demonstrate DDM-AERO performance • “Limits of linearity” for each pollutant • Apply DDM-AERO to evaluate emissions changes: • Point SO2, Area SO2, Point NOx, Mobile NOx, Area NH3... • States, regions, boundary conditions • Test options to revise CMAQ code to improve model efficiency
VISTAS Episode Selection • Characterization of Meteorology and its Relationships to Visibility and Fine Particulate Mass in the VISTAS Region • System Application International, Inc. (SAI) applying Classification and Regression Tree (CART) analyses • Identify modeling days that adequately represent the 20% haziest and 20% clearest days within a specific year • Evaluate how representative a specific modeling year is for the 2000–2002 (2000–2004) baseline period at each Class I area
Meteorological, Emissions, and Air Quality Modeling Deliverables Draft 10/31/03 Jan-Mar 2004 Define BART sources June 2004 Identify BART controls Dec 2003: Revised Em Inv Base 2002 Mar 2004: Draft Em Inv 2018 July 2004: Revised State Em Inv Base 2002 Sept 2004: Revised Em Inv 2018 Oct-Dec 2004: Control Strategy Inventories Aug 2003: Emissions Inventory Base 2002 Jan 2004: Met, Em, AQ model testing 3 episodes Jan 2004: Modeling Protocol Sept 2004: Annual Base Year Model Runs Dec 2004: Annual Run 2018 Jan 2005: Sensitivity Runs 2018 episodes Jan-Jun 2005: Control Strategy Runs 2018 EPA- approved Modeling Protocol Oct 2004: Sensitivity Runs 2018 3 episodes July-Dec 2005: Observations Conclusions Recommendations Apr 2004: DDM in CMAQ Mar 2004: CART:select sensitivity episodes Optional Optional State Regulatory Activities Before Jun 2005 Other Inventory: e.g. Power Plant Turnover After Jun 2005 Model Runs: e.g. Power Plant Turnover