Download
1 / 53
530 likes | 653 Views
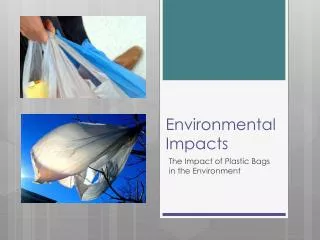
Environmental Impacts CE 355 December 8, 2010. Types of Impacts. Air Water Noise Visibility. Human Plants and Animals Environment Quality of life Health Safety Ambience Aesthetics Climate change (global warming).

E N D
Environmental Impacts CE 355 December 8, 2010
Types of Impacts • Air • Water • Noise • Visibility • Human • Plants and Animals • Environment • Quality of life • Health • Safety • Ambience • Aesthetics • Climate change (global warming)
No View of the San Gabriel Mountains in the Los Angeles Basin (July 15, 1995)
View of the San Gabriel Mountains in the Los Angeles Basin (July 17, 1995)
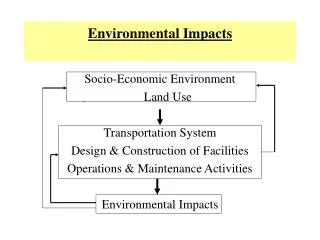
Environmental Impacts of Transportation • Air Pollution → CE 524 • Noise Pollution → CE 453 • Runoff → CE 453 • Construction Impacts • Primer on transportation climate change AASHTO (April 2008) • http://downloads.transportation.org/ClimateChange.pdf
Air Quality / Pollution • Presence of undesirable material in the air of sufficient quantity to produce harmful effects • Pollutants • Particulate matter: ash, dust, mist, smoke • Gases: CO, CO2, SO2, NOx • Volatile Organic Compounds (VOCs) • Sources • Human (anthropogenic) • Natural sources • Thermal inversion
Global Warming and CO2 • Concentrations have raised 36% since 1750 • US contributes approximately 20% • US → fuel combustion accounted for 94.4% in • 2007 (transportation 33% of fossil fuel combustion) • No health concerns • Would result from complete combustion • But it is a "greenhouse gas" • Absorbed by oceans • In equilibrium, carbon fluxes are roughly balanced
WhatCausesAirPollutionToday? Mobile Sources • Highway vehicles: cars, trucks, buses and motorcycles • Off-highway vehicles such as aircraft, boats, locomotives, farm equipment, RVs, construction machinery and lawn mowers Stationary Sources • Combustion of fuels for power and heat • Other burning such as incineration or forest fires •Industrial/commercial processes • Solvents and aerosols Fundamentals of Air Pollution and Motor Vehicle Emissions John T. White, EPA
Source: http://www.fhwa.dot.gov/policyinformation/travel/tvt/history/
We WantMoreEnergyandMoreVehicles Electricity (trillions of kw-hours) 3 2 1 0 1940 1950 1960 1970 1980 1990 Highway Vehicles (millions) 200 100 0 1940 1950 1960 1970 1980 1990 Fundamentals of Air Pollution and Motor Vehicle Emissions John T. White, EPA
WeDrive Moreand UseMore Fuel Miles Traveled (trillions) 2 1 0 1940 1950 1960 1970 1980 1990 Fuel Used (billions of gallons) 150 100 50 0 1940 1950 1960 1970 1980 1990 Fundamentals of Air Pollution and Motor Vehicle Emissions John T. White, EPA
Aircraft Marine Military Trains construction Small engine Lawnmower Snow blower etc Passenger vehicles Heavy trucks Motorcycles Motor homes buses On-road Mobile Sources Non-road http://epa.gov/otaq/
Challenges • Per vehicle emissions greatly reduced since 1970 • In the same time period, the number of miles we drive has more than doubled • Travel increase has almost offset the emission control progress • Net result is only a modest reduction in each automotive pollutant • Lead has dropped by more than 95 % Source: EPA 400-F-92-007 August 1994 Fact Sheet OMS-5
Automobile Emissions: An Overview • Emissions from an individual car <<< smokestack • But multiply emissions by millions of vehicles • Driving a private car is probably a typical citizen's most "polluting" daily activity Source: EPA 400-F-92-007 August 1994 Fact Sheet OMS-5
Sources of Auto Emissions • The power to move a car comes from burning fuel in an engine • Pollution is a by-products of this combustion process (exhaust) and from evaporation of the fuel itself Source: EPA 400-F-92-007 August 1994 Fact Sheet OMS-5
Combustion • Gasoline and diesel fuels are mixtures of hydrocarbons • Compounds which contain hydrogen and carbon atoms • With complete combustion, oxygen in the air converts all the hydrogen in the fuel to water and all the carbon in the fuel to carbon dioxide. Nitrogen in the air remains • But this does not actually occur in the engine Source: EPA 400-F-92-007 August 1994 Fact Sheet OMS-5
Combustion • "Perfect" Combustion: FUEL (hydrocarbons) + AIR (oxygen and nitrogen) ==>> CO + water + unaffected nitrogen • Typical Combustion FUEL + AIR ==>> Unburned HC + NOx + CO + CO2 + water Source: EPA 400-F-92-007 August 1994 Fact Sheet OMS-5
Calculating Emissions Total emissions = emission rate x vehicle activity Example: Emission rate from MOBILE6 for CO is 35 grams/mile A city has 1000 miles of roadway and an average of 2000 vehicles per mile per day use the road. Calculate total CO emission for 1 day. Total CO = 35 g/mile (1000 miles x 2000 vehicles) = 70,000 kg of CO
Vehicle Activity at Regional Level • VMT estimates from HPMS or output from travel demand forecasting • Total of vehicle volume and travel • Speeds • Output of travel demand models • Uses adjust as volume increases, speed decreases
Emission Factors • Developed by USEPA • From vehicle testing • An estimate of grams of pollution per second of vehicle activity or per mile of vehicle activity • Emission rates • grams/vehicle mile of travel • grams/start • grams/soak • Carbon monoxide, hydrocarbons, oxides of nitrogen • 25 vehicle model years
Electric Vehicles (EVs) • Zero emissions • But • Large / heavy batteries • Short range ( < 70 miles); • Tesla ~ 245miles range ($109k!) • Long time to recharge versus IC which takes minutes to refuel
Hybrid Vehicles • Combination battery/IC engine • IC engine charges the battery • Both engine and electric motor can turn the transmission at the same time • Battery also absorbs energy in regular driving, braking losses • Plug-in Hybrid EVs (PHEVs) Image source:http://www.hev.doe.gov/
History of Air Pollution in the US • 1940s early efforts to reduce air pollution • First state effort (1947): CA, worsening conditions in the Los Angeles basin • Coined the term “smog” (smoke & fog) • Air pollution episodes responsible for illness and death in several areas • Pittsburgh – 1948: industrial emissions and temperature inverse created SO2 • 20 deaths • Respiratory illness in half the population • Ordinances began locally state national • Major legislative and regulatory acts from 1955 to 1970
Automobile Emission Control • The Clean Air Act of 1970 gave EPA authority to regulate motor vehicle pollution • Emission control policies have become progressively more stringent since 1970's • EPA standards set pollution limits for autos • Automakers decide how to achieve them • Early emission reductions (1970's) • fundamental improvements in engine design • charcoal canisters -- collect HC vapors • exhaust gas recirculation valves -- reduce nitrogen oxides Source: EPA 400-F-92-007 August 1994 Fact Sheet OMS-5
Clean Air Act Amendments of 1970 • Air & water pollution major societal concerns • All administrative functions for air pollution transferred to newly created EPA • Intended to achieve clean air by 1975 • Regulation of • Criteria air pollutants • Hazardous air pollutants
Major Provisions of 1970 CAAA • Set auto standards: • CO & HC at 90% of 1970 levels • 90% NOx for 1971 model year • but Congress controls actual levels of performance • Established National Ambient Air Quality Standards (NAAQs) • Limits at which air pollutants affect public health • Primary –to protect public health • Secondary – protects public from other effects of air pollution • Plants, animals, visibility, public enjoyment of life & property
Air Quality Criteria • Based on levels to protect human health • Sensitive members of the population • Developed based on relationship between exposure and short and long-term health and welfare effects • Effects are expected to occur when pollutant levels exceed criteria for specified time period • Short-term -- immediate protection • Chronic exposure • Pollutant levels cannot legally be exceeded during specific time period in a specific geographical area
Automobile Emission Control • 1975: "first generation" catalytic converters • significantly reduced HC and CO • Indirect benefit: lead inactivates the catalyst so widespread introduction of unleaded gasoline occurred • dramatic reductions in ambient lead levels Source: EPA 400-F-92-007 August 1994 Fact Sheet OMS-5
Automobile Emission Control • 1980: in response to tighter standards, new cars were equipped with even more sophisticated emission control systems • Usually "three-way" catalyst • Converts CO and HC to CO2 and H20 • Also reduces NOx to elemental nitrogen and oxygen • On-board computer and oxygen sensor • optimizes the efficiency of the catalytic converter. • 1990 Clean Air Act • Tighter tailpipe standards • Improved control of evaporative emissions • Computerized diagnostic systems to identify malfunctioning emission controls. Source: EPA 400-F-92-007 August 1994 Fact Sheet OMS-5
Clean Air Act Amendments of 1990 • Even with CAA and prior amendment • 96 cities still nonattainment for ozone • 41 cities for CO • 70 cities for PM10 • Most significant changes since CAA • 11 major divisions
Title II of CAAA of 1990: Mobile Sources • Motor vehicles • 50% Ozone precursors • VOC • NOx • 90% of CO • Mobile source designations • Passenger vehicle • Truck • Set standards for emission reduction – technology • Requires reformulated gasoline (15% less VOC) in cities with worst O3
Criteria AirPollutants • Carbon Monoxide (CO) • Hydrocarbons • Oxides of Nitrogen (NOx) • Sulfur Dioxide (SO2) • Particulate Matter (PM10) • Lead (Pb) Fundamentals of Air Pollution and Motor Vehicle Emissions John T. White, EPA
Pollutant Averaging Time Primary Standard Secondary Standard CO 8 hr 9 ppm Same 1 hr 35 ppm Same NO2 Annual average 0.05 ppm None SO2 Annual average 0.03 ppm None 24 hr 0.14 ppm None 3 hr None 0.5 ppm PM10 Annual arithmetic mean 50 g/m3 Same 24 hr 150 g/m3 Same PM2.5 Added 1997 Annual arithmetic mean 15 g/m3 Same 24 hr 150 g/m3 Same Ozone 1 hr 0.12 ppm Same 8 hr 0.08 ppm Same Lead 3 months 1.5 g/m3 same Current NAAQS
Hydrocarbons • Result when fuel molecules in the engine do not burn or only partially burn • React in the presence of nitrogen oxides and sunlight to form ground-level ozone, a major component of smog • Ozone irritates the eyes, damages the lungs, and aggravates respiratory problems • most widespread urban air pollution problem. • A number of exhaust hydrocarbons are also toxic, with the potential to cause cancer. Source: EPA 400-F-92-007 August 1994 Fact Sheet OMS-5
Evaporative Emissions • HC also escape into the air through fuel evaporation • With efficient exhaust emission controls and today's gasoline formulations, evaporative losses can account for a majority of the total HC from current model cars on hot days when ozone levels are highest Source: EPA 400-F-92-007 August 1994 Fact Sheet OMS-5
Oxidesof Nitrogen(NOx) • Nitrogen & oxygen atoms in the air react under high pressure and temperature in an engine • Nitrogen oxides, collectively known as NOx, form • Also precursors to the formation of ozone • Also contribute to the formation of acid rain • Yellow/brown component of smog Source: EPA 400-F-92-007 August 1994 Fact Sheet OMS-5
Oxidesof Nitrogen(NOx) • Nitrogen dioxide is the prominent one (it's the yellow-brown color in smog) • NOx results from high temperature combustion processes, e.g. cars and utilities • They affect the respiratory system • They play a major role in atmos- pheric reactions • Overall levels unchanged but transportation sources are cleaner Fundamentals of Air Pollution and Motor Vehicle Emissions John T. White, EPA
Carbon Monoxide (CO) • Product of incomplete combustion • Occurs when carbon in the fuel is partially oxidized rather than fully oxidized to carbon dioxide (CO2 ) • CO reduces the flow of oxygen in the bloodstream • Particularly dangerous to persons with heart disease • Immediate health effects Source: EPA 400-F-92-007 August 1994 Fact Sheet OMS-5
CarbonMonoxide(CO) • Odorless, colorless gas • Caused by incomplete combustion of fuel and air • Primarily from motor vehicles • Reduces the transport of oxygen through the bloodstream • Affects mental functions and visual acuity, even at low levels • Improvements are being made but there are still problems in some urban areas Fundamentals of Air Pollution and Motor Vehicle Emissions John T. White, EPA
ParticulateMatter(PM10) • PM10 is a general term for tiny airborne particles (under ten microns), e.g., dust, soot, smoke • Primary sources are fuel-burning plants and other industrial/ commercial processes • Some are formed in the air • They irritate the respiratory system and may also carry metals, sulfates, nitrates, etc. • Some overall decreases seen but trends may be masked by meteorological changes Fundamentals of Air Pollution and Motor Vehicle Emissions John T. White, EPA
ParticulateMatter(PM10)Also regulating PM2.5 • PM10 is a general term for tiny airborne particles (under ten microns), e.g., dust, soot, smoke • Primary sources are fuel-burning plants and other industrial/ commercial processes • Some are formed in the air • They irritate the respiratory system and may also carry metals, sulfates, nitrates, etc. • Some overall decreases seen but trends may be masked by meteorological changes Fundamentals of Air Pollution and Motor Vehicle Emissions John T. White, EPA
Health Effects of PM • Particles directly enter respiratory system • Particles themselves may be toxic • Particle may interfere with mechanisms which clear the respiratory tract • Particle may act as carrier of absorbed toxic substance • 20 to 60% of particles between 1 and 2.5 µm breathed will penetrate into lungs • Enter deep tissue
SulfurDioxide(SO2) • This term is used for a number of compounds containing sulfur • Primarily caused by burning of coal, oil and various industrial processes • They can affect the respiratory system • They react in the atmosphere to form acids, sulfates and sulfites • Substantial reductions due to controls at the sources and through use of low sulfur fuels • Make up 5 to 20% of total suspended particles • Major damage to materials • Contributes to acid rain Fundamentals of Air Pollution and Motor Vehicle Emissions John T. White, EPA
Lead(Pb) • Long known as one of the worst toxics in common use • Emitted from gasoline additives, battery factories and non-ferrous smelters • Affects various organs and can cause sterility and neurological impairment, e.g. retardation and behavioral disorders • Infants and children especially susceptible • Control of mobile sources has been exceptionally successful Fundamentals of Air Pollution and Motor Vehicle Emissions John T. White, EPA
Ozone • Secondary pollutant • Forms from NOx and HC plus sunlight • Cause respiratory problems