Download
1 / 14
140 likes | 311 Views
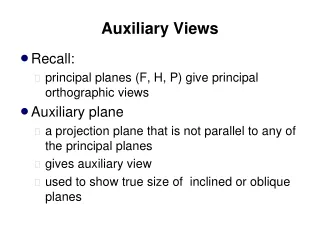
Two auxiliary programs. Modelviewer 3D visualization of input or output GW-Chart plots information about model fit etc. ModelViewer– a program for displaying results of ground-water models by Paul Hsieh & Richard Winston, USGS. ModelViewer.

E N D
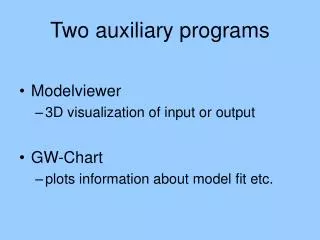
Two auxiliary programs • Modelviewer • 3D visualization of input or output • GW-Chart • plots information about model fit etc.
ModelViewer– a program for displaying results of ground-water modelsby Paul Hsieh & Richard Winston, USGS
ModelViewer • Free USGS program. Obtain from:http://water.usgs.gov/software/ground_water.html • Supports 3D visualization of input or output for a suite of models, including MODFLOW-2005, MODFLOW-2000, MODFLOW-2000 with Ground-Water Transport Process, MODFLOW-96, MOC3D, MODPATH, MT3DMS, SUTRA, and PHAST
ModelViewer • Reads in the MODFLOW-2005 ‘name’ file then imports existing model input and output files • Must have run the model and have head output. • You have an executable or a shortcut to ModelViewer in your bin-plotting folder • Open model created in exercise 3.1.
ModelViewer Instructions • The next slide provides instructions for using ModelViewer to visualize heads and hydraulic conductivity (K) • The following slide provides instructions for using ModelViewer to visualize an objective-function. Only available when using UCODE_2005. • For more information, see the ModelViewer online help system.
ModelViewer Instructions: head and K • Execute ModelViewer. Start with visualizing hydraulic heads. • Under the File menu item, select New. • Model Selection dialog box: select Modflow 2000. • Modflow 2000Data Files dialog box: browse to name file (e.g. ex3.2.nam). • Data Selection dialog box: keep defaults. The model domain appears. • Show menu item: select Solid, then Model Features. • Model Features dialog box: select both model features. • Toolbox menu item: select Geometry and set z to 10 to specify 10x vertical exaggeration. See a floodmap of hydraulic heads. • Show menu item: select Colorbar • Rotate by clicking and dragging any corner. To return to original, under the Action menu item click View From Direction and choose +z. • Now, visualize hydraulic conductivity (K). • Toolbox menu item: select Data and choose K along rows. • Toolbox menu item: select Solid; select Blocky. • Toolbox menu item: select Crop. Reduce the Max for Z until you can see first the hydraulic conductivity of the confining unit, and then of the lower model layer.
ModelViewer Instructions: SOS • Only available with UCODE_2005. • Execute ModelViewer. • Under the File menu item, select New. • Model Selection dialog box: select UCODE 2005 - SOS. • UCODEData File dialog box: browse to the ex5.1 directory. Click on the _sos file. • Data Selection dialog box: keep defaults. See the parameter domain. • Show menu item: select Solid. • See the previous slide for ideas for manipulating the graph.
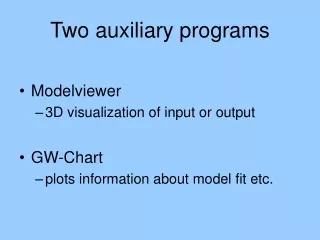
Two auxiliary programs • Modelviewer • 3D visualization of input or output • GW-Chart • plots information about model fit etc.
GW_Chart • Free USGS program. Obtain from: http://water.usgs.gov/software/ground_water.html • Plots results from many of the files for which the filename extension starts with “._” (e.g. ex5.2._b) These are produced by MODFLOW-2000, UCODE_2005, and some other programs. UCODE_2005 calls these “data-exchange” files • GW_Chart is very useful for quick analysis of model fit, sensitivities, parameter value changes by regression, etc.
GW_Chart • The user identifies the program that produced the files (MODFLOW-2000 or UCODE_2005) and then navigates to one of the files. GW_Chart assumes the rest are in the same directory and have the same filename prefix. • Must have run the model and have the data-exchange files. • You have an executable or a shortcut to GW_Chart in your bin-plotting folder • Use GW_Chart to produce the following graphs • Composite and dimensionless scaled sensitivities for the exercises in Chapters 4 and 7 • Updated parameter values for exercises in Chapter 5, the residual analysis for the exercises in Chapter 6, and the parameters and their confidence intervals in Chapter 7.
Instructions for GW_Chart • Execute GW_Chart. The window on the next slide appears. • Identify the program that produced the files to be plotted in a drop-down menu on the top right (MODFLOW-2000 or UCODE_2005) • Click File on the top left part of the window and then “Open File”. Navigate to the directory containing the files of interest. Open one file. GW_Chart looks for other files in that directory with the same filename prefix and filename extensions that it recognizes. These files are listed in the dropdown menu labeled “File:” in the upper middle part of the window. • The filename extensions and the associated file content are described in the documentation of MODFLOW-2000 (Hill and others, 2000, p. 28-29) and UCODE_2005 (Poeter and Hill, 2005, p. 231-233). • Graphs of other data sets are obtained by choosing other files from the drop-down menu labeled “Files:”
GW_Chart: three issues • What to do if the expected files are not being produced. • MODFLOW-2000: check the file for all observations (Hill+, 2000, p. 27) • UCODE_2005 keyword DataExchange (Poeter and Hill, 2005, p. 58) • Graph options are provided by GW_Chart in a popup window. • Graph produced for the file with extension _ws • Vertical axis used for weighted residuals has a scale using multiples of the standard error of the regression. This has advantages discussed later in the course.