Download
1 / 26
260 likes | 392 Views
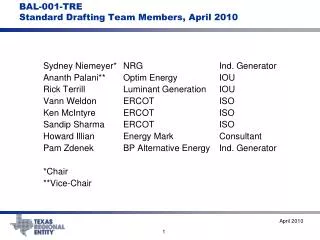
BAL-001-TRE-01. ERCOT CPS2 R2 Waiver Regional Variance March 31, 2009 Sydney Niemeyer. Work Product. Draft standard consistent with SAR on which it was based. include requirements concerning frequency response contained in the ERCOT Protocols, section 5

E N D
BAL-001-TRE-01 ERCOT CPS2 R2 Waiver Regional Variance March 31, 2009 Sydney Niemeyer
Work Product • Draft standard consistent with SAR on which it was based. • include requirements concerning frequency response contained in the ERCOT Protocols, section 5 • include Requirements, Measures, and Levels of Non-Compliance sections • determining the minimum frequency response needed for reliability and requiring appropriate generators to have specific governor droop to be a more stringent practice than requirement R2 in BAL-001-0
Impact on Existing Standards • Identification of any existing Standard that will be deleted, in part or whole, or otherwise impacted by the implementation of the draft Standard • Protocol Section 5.9.2, 5.9.2.1, 5.9.3 • Protocol Section 6.8.1.15.3 Uninstructed Charge must account for all frequency response. • Operating Guides Section 2.2.5 (deadband) • Operating Guides Section 6.2.1.6 (deadband)
Goals of the Variance • Document the perceived reliability impact should the Standard be approved. • Improved frequency profile will increase probability that frequency will be near 60.000 Hz when a perturbation occurs. • Improved frequency stability even with an increase in variable generation. • Support for Voltage and Automatic Voltage Regulators by supplying appropriate energy delivery during perturbations.
Goals of the Variance, continued • If an electrical island forms within the ERCOT Interconnection, this variance will provide the best probability of both islands surviving. • Resources, through correct frequency response, will know immediately the correct action to take to balance the generation to the demand of each island.
Due to the small amount of frequency response within the deadband, MW needed in Resource movement to return to schedule frequency is much less than ERCOT ACE. Existing +/-0.036 Hz allowable deadband ERCOT ACE +/- 237.6 MW CPS2 10 minute average ACE Limit = 143.2 MW (0.0217 Hz)
Smaller deadband on Resources provides resistance to frequency change sooner. This results in three things 1) Overall frequency response needed from the Resource is less. 2) ERCOT ACE more closely represents the MW needed to return frequency to schedule. 3) Greater frequency stability. Proposed +/-0.0166 Hz allowable deadband ERCOT ACE +/- 110 MW CPS2 10 minute average ACE Limit = 143.2 MW (0.0217 Hz)
10:41:02.975 60.025 Hz (3601.5 rpm) 1.854 seconds to reach 59.900 Hz (3594 rpm) 10:41:04.829 5.810 seconds to reach 59.785 Hz (3587.1 rpm) from pre-event 10:41:08.785
28910 MW 28815 MW 786 MW Unit Tripped. Difference in Load MW = 95. Seconds after the trip, where did the other 691 MW come from? = 95 MW difference.
59.860 – 59.300 = 0.560 Hz. At 73 MW/0.1 Hz load response 73 x 5.6 = 409 MW ERCOT has LaaR that trip at 59.700 Hz so firm load shed would not occur, but this demonstrates the importance of sustained frequency response from all Resources. Load responded 95 MW (decreased) for a 0.13 Hz change in frequency or 73 MW/0.1 Hz. If the 691 MW of frequency response from other generators is not sustained what would frequency do? If 409 MW of the 691 MW of frequency response was withdrawn and other generators did not respond further, frequency would reach 59.300 Hz. (firm load shed)
Net Generation 105 MW Capacity Resource. MP A providing 5% droop with no governor deadband. This provides the Interconnection the greatest stability in frequency control.
SCE MP A providing 5% droop with no governor deadband and Bias closely matching actual frequency response. SCE of previous graph.
SCE MP A providing 5% droop with no governor deadband and Bias NOT matching actual frequency response. If QSE and the Resource is on AGC, control actions will reverse frequency response
Net Generation Resource with governor out of service and not providing frequency response. Does not meet current Protocols, Operating Guides or this Regional Variance.
SCE Resource with governor out of service and bias set to zero, which matches frequency response. Does not meet current Protocols, Operating Guides or this Regional Variance and does not result in excessive SCE.
SCE Resource with governor out of service and bias set to non zero value, which does not match frequency response. Does not meet current Protocols, Operating Guides or this Regional Variance and will result in AGC that will “shadow” frequency response.
105 MW Capacity, 5% droop, Zero Deadband GOP GO 3.5 MW/0.1 Hz 3.5 MW/0.1 Hz 3.5 MW/0.1 Hz 59.9 Hz 50 MW 50 MW 53.5 MW
Short fall of Variance • Does not measure Frequency Response at Point C (lowest frequency point during first 5 to 6 seconds of the perturbation).
In addition, I recently performed some simulations on the Texas Interconnection to investigate the effect of a delay in the delivery of Frequency Response. First I simulated a disturbance event. The actual event is shown in Red and the simulation is shown in Blue.
I then modified the Governor Response to deliver it on a delayed basis. In this case the additional delay was about five seconds. It can be seen that the delay significantly affected the nature of the response.
Simulations were performed to evaluate how much this kind of delay would affect the interconnection reliability as measured by the size of a disturbance that would cause underfrequency relays to trip at 59.3 Hz. The limit changed from 3150 MW without a delay to 1930 MW with a delay. The risk changed from one event in 250 years to about 2 events per year. This indicates that we must address the Frequency Response component of balancing. It also indicates that we may not be able to use controllable loads unless they act as independent agents controlled locally without remote communications. This is necessary to avoid the detrimental effects of unavoidable communications delays.
References • Energy Mark: Link to Howard Illian’s complete presentation “Integrating Renewable Resources” http://www.ece.cmu.edu/~tanddconf_2004/2009%20CMU%20Smart%20Grids%20Conf%20Disk/Presentations/Day%201/Session%201/
Questions? Sydney L. Niemeyer NRG Texas Power 713-795-6108 Sydney.niemeyer@nrgenergy.com