Download
1 / 16
160 likes | 246 Views
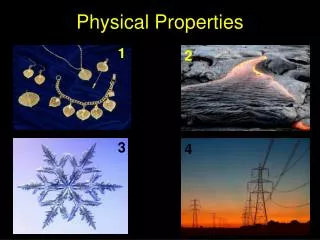
Physical Properties. Discharge rate, temperature and other physical attributes of the stream. Physical Properties of Streams:. Water Temperature Stream flow Turbidity Total Dissolved Solids: Dissolved Solids Undissolved Solids. Found at: ucc.ie. Stream Flow/Stream Discharge:.

E N D
Physical Properties Discharge rate, temperature and other physical attributes of the stream.
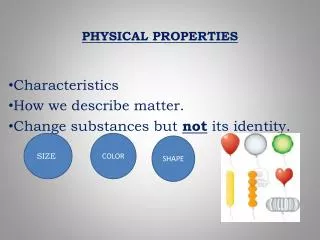
Physical Properties of Streams: • Water Temperature • Stream flow • Turbidity • Total Dissolved Solids: • Dissolved Solids • Undissolved Solids Found at: ucc.ie
Stream Flow/Stream Discharge: • Amount of water flowing in a stream, river, or other flowing body of water • Key concept of a stream and its flow is its watershed • Stream flow is always changing • main influence precipitation • size of a river = size of its watershed
Effects of Stream Flow on a Ecosystem: • Sufficient flow must be present to maintain downstream ecosystems • Changes to the natural flow regime affect stream communities, species interactions, and ecosystem functioning • Flow can affect: • abundance, distribution, and behavior of stream organisms • key ecological processes such as dispersal, habitat use, resource acquisition, and competition Found on US EPA’s National Center for Environmental Research Website
Turbidity: Measure of how cloudy or transparent the water is More TS → higher turbidity → murkier water Causes: phytoplankton, erosion, waste, algae, runoff Effects: warmer water, lower D.O., allows heavy metals and other toxins to attach, “dirty” water World Health Organization states turbidity of drinking water should be 5 JTU or lower.
Total Suspended Solids: • Amount of solid suspended in water • Measures actual weight of material per volume of water • calculates total quantities of material within a stream • Classification of TDS levels: • Fresh water < 1500 mg/L TDS • Brackish water: 1500 to 5000 mg/L TDS • Saline water >5000 mg/L TDS
TDS Levels: High TDS caused by: • erosive heavy rains and fast-moving water • soils and geology determine how much erosion occurs • can be affected slightly by changes in algae populations and other microscopic life • High levels can: • cause increased sedimentation and siltation in a stream • ruin important habitat areas for aquatic life • Dissolved particles also provide attachment places for other pollutants • High TDS or turbidity readings can be used as "indicators" of other potential pollutants
Possible Effects on TDS & Turbidity: • Greatest Factor: Land Use • As watersheds develop, there is an increase in disturbed areas (e.g., cropland or construction sites), a decrease in vegetation, and increases in the rate of runoff. • These all cause increases in erosion, particulate matter, and nutrients, promote algal growth, and increase TDS and turbidity of water.
Physical Properties of the Leibert Creek: • Water Temp: 13.5°C • Turbidity: 0 JTU • Total Dissolved Solids: 195 ppm (mg/L); clear water! • Stream Discharge: • 6.8176 cu ft/s • 50.7229 gal/s • 182,603 gal/hr • 4,382,462 gal/day Found at: dcnr.state.pa.us
Leibert Creek Results: • The flow of the Leibert was as to be expected; no bad effects on the stream and its ecosystem. • Examples of the calculations used to find stream flow can be found on the handout given to you. • There was no turbidity in the stream, showing that the stream water is clear and unpolluted. • There was a relatively low TDS level in the Leibert, showing that there was only a normal amount of pollution in the stream, as can be caused naturally.
Physical Properties of the Little Lehigh: Turbidity: 5 JTU TS: 177 ppm TDS: 167 ppm US: 10 ppm Flow Rate: 52,358,400 gal/day Found at: coldwaterheritage.org
Calculating Discharge Rate • 81ft3 = 606 gal/sec • 52358400 gal/day • Little Lehigh in Allentown: • found at <http://waterdata.usgs.gov/nwis/>
Works Cited: "Investigating the Impact of Lowered Stream Flow on Stream Community Structure and Ecosystem Functioning|Research Project Database | NCER | ORD | US EPA." U.S. EPA ColdFusion Server. Web. 02 Nov. 2010. <http://cfpub.epa.gov/ncer_abstracts/index.cfm/fuseaction/display.abstractDetail/abstract/8153>. "Stream Total Suspended Solids and Turbidity - Chapter 3 - Streams in A Citizen'sGuide to Understanding and Monitoring Lakes and Streams." Washington State Department of Ecology | Home Page | ECY WA DOE. Web. 02 Nov. 2010. <http://www.ecy.wa.gov/programs/wq/plants/management/joysmanual/streamtss.html>. "The Water Cycle: Streamflow, from USGS Water Science for Schools." USGS Georgia Water Science Center - Home Page. Web. 02 Nov. 2010. <http://ga.water.usgs.gov/edu/watercyclestreamflow.html>.