Download
1 / 23
230 likes | 317 Views
Spatial Relationships between Socio-economic Indicators and Floodplain Maps in North Carolina: Are Digital Flood Insurance Rate Maps a Good Answer for Flood Policy?. Lauren Patterson December 6, 2006 Geography 593. 90% of natural disasters in US are floods.

E N D
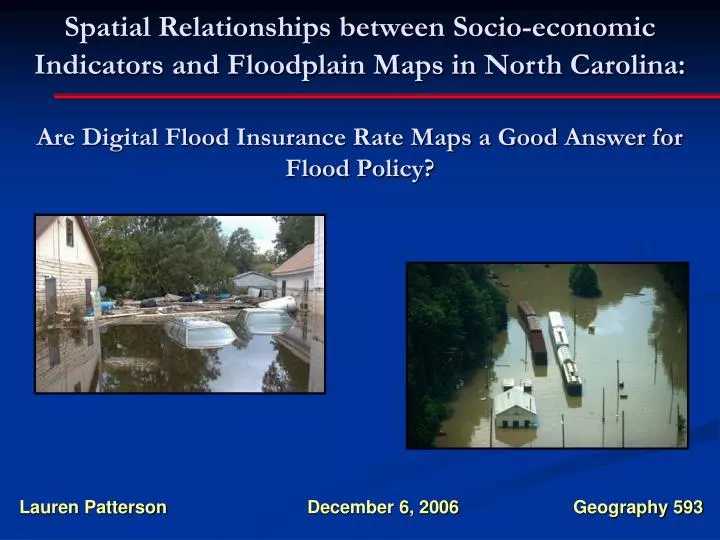
Spatial Relationships between Socio-economicIndicators and Floodplain Maps in North Carolina:Are Digital Flood Insurance Rate Maps a Good Answer for Flood Policy? Lauren Patterson December 6, 2006 Geography 593
90% of natural disasters in US are floods • Shift from rural to urban • Increasing costs through time Overview of Hazards in US ECONOMIC COSTS OF HAZARDS $6 - $10 Billion = all hazards $2.3 - $4 Billion = floods
100 year floodplain concept Hurricane Floyd Source: Jackson, 2002 U.S. Flood Control Policies • Government Policy: • Structural Control • National Flood Insurance Program • Mitigation and Floodplain Zoning
Research Questions • What is the geographic relationship of people and property inside and outside of the 100 and 500 year floodplains? • Specifically, is there a large increase in people and property directly outside the 100 year floodplain boundary, where regulations cease? 2) How do the DFIRM values for the 100 and 500 year floodplain compare with the original FIRM values?
Selected Counties Selected Counties Study Area and Data Availability Study Sites: 1) Wake County: Piedmont 2) Craven County: Coastal Plains 3) Buncombe County: Mountains
Methodology: Form 1 – Data Preparation COUNTY LEVEL NLCD, DEM, Population, Parcel NLCD DEM Population Data Parcel Data Project to NC State Plane (m) Mask to County Extract County NC Counties
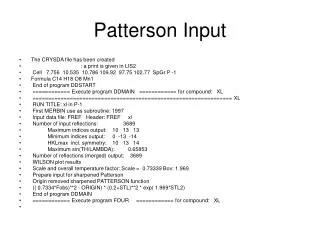
Methodology: Form 1 – Data Preparation Run a portion of the code as demo File = Workspace & "\Projected\" & County & "County.shp" If gp.Exists(File) Then MsgBox "The County file has already been clipped." Else Call ClipCounty(County, Workspace & "\Projected\County.shp", File) End If Dim ClipFile As String ClipFile = File File = Workspace & "\Projected\" & County & "DFIRMS.shp" If gp.Exists(File) Then MsgBox "The DFIRM file has already been clipped." Else Call ClipDFIRMS(Workspace & "\Projected\DFIRMS.shp", File, ClipFile) End If Dim gp As Object Set gp = CreateObject("esriGeoprocessing.GPDispatch.1") 'Check to see if the file already exists File = Workspace & "\Projected\Pop" & County & "00.shp" If gp.Exists(File) Then MsgBox "The population data has already been projected." Else Call ProjectFeatures(Workspace & “Raw\Population\" + County + "00.shp", File) End If
Methodology: Form 1 – Data Layers Created DEM NLCD DFIRM PARCEL 2000 POP FIRM
Methodology: Form 2 – Creating Floodplain Layers 100 yr 500 yr Run Code for DFIRMS
Methodology: Form 2 – Creating Analysis Layers NLCD Type Building Tax Population Water 0 0 Low Density Residential 5000 7 High Density Developed 50000 20 Commercial, Industrial 50000 10 High Density Residential 50000 20 Barren Land 1 0 Deciduous Forest 500 0 Evergreen Forest 500 0 Mixed Forest 500 0 Shrub 1 0 Grasslands 1 0 Pasture/Hay 500 0 CultivatedCrops 500 0 Woody Wetlands 1 0 Herbaceous Wetlands 1 0
Methodology: Form 2 – Creating Analysis Layers TaxSurface = FinParLand + FinParBuild Process for Reclassifying NLCD Process for Creating Land Tax Surface Process for Creating Building Tax Surface Process for Creating Total Tax Surface Figure 4A: Tax Surface for Craven County
Methodology: Form 2 – Creating Analysis Layers Run Population Code
500 DFIRM/FIRM # People Affected Amt Land Cover Type Affected Parcel Money Affected Maximum DEM Height 100 DFIRM/FIRM # People Affected Amt Land Cover Type Affected Parcel Money Affected Maximum DEM Height Socio-Economic Differences between Floodplains = - Methodology: Form 3 - Spatial Analysis 100 Yr DFIRM 100 Yr FIRM 100 /500 Yr Flood # People % Land Cover Type Property Value NLCD, DEM, Population Surface, Tax Surfaces Zonal Stats as a Table 500 Yr DFIRM 500 Yr FIRM
Run Code for 1st Button Agree FIRM Differ DFIRM Differ Methodology: Form 3 - Spatial Analysis
Figure 9: Results: Craven County
Population Tax Results: Wake County
Population Tax Results: Buncombe County
CONCLUSIONS • Increased Development Density outside the 100 yr Floodplain • Indicates floodplain boundaries are working? • Indicates development directly outside regulation? • Differentiation between different topographies influences floodplain boundaries and the extent of development within those boundaries. • More people and property were protected in FIRMS than in the new DFIRMS • The programming of this process enables rapid analysis of additional counties.
QUESTIONS??? QUESTIONS???
100 yr floodplain 500 yr floodplain Results: DFIRM Versus FIRM Agreement WAKE CRAVEN