Download
1 / 41
410 likes | 493 Views
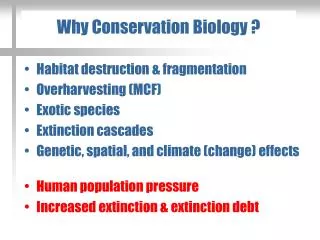
BB30156 Conservation Biology. Tools: Monitoring and population estimation. What is monitoring?. ‘To watch, to keep track of, or check for a specified purpose’ Count individuals/ species richness/ diversity over time to detect change Series of standardised surveys. Why monitor?.

E N D
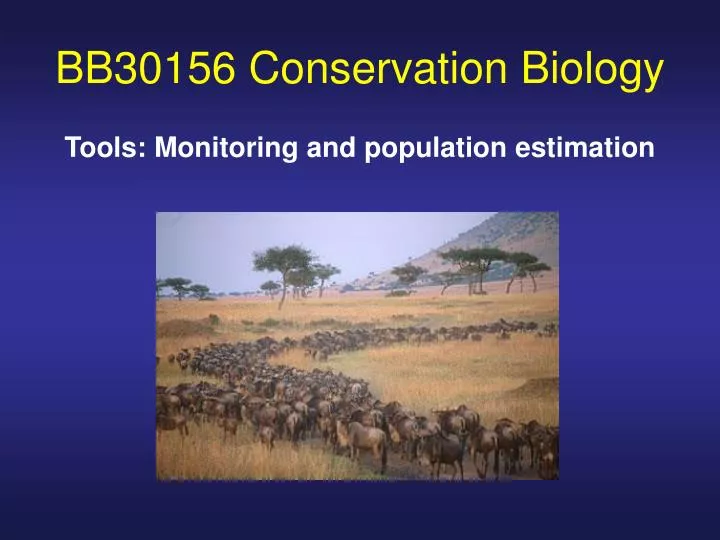
BB30156 Conservation Biology Tools: Monitoring and population estimation
What is monitoring? • ‘To watch, to keep track of, or check for a specified purpose’ • Count individuals/ species richness/ diversity over time to detect change • Series of standardised surveys
Why monitor? • Monitoring is needed to assess the effectiveness of conservation measures and to provide early warning of problems • Results of monitoring should be fed into regional, national and global conservation targets • E.g. 2010 Biodiversity Target of Convention on Biological Diversity (CBD)
Monitor Research Action Monitor What is the cause? Test solution Detect a problem Did the management work? What is the solution? Implement solution Conservation needs monitoring Carry on monitoring…
Conservation needs monitoring • Abundance and distribution are fundamental • Conservation of endangered species • Management of pest species • Managing harvested populations
Conservation needs monitoring • Detection of trends in all populations is important • If declining fast, can intervene before population becomes too small • Science or evidence based wildlife conservation and management
‘Scientific monitoring’ by professionals ‘Participatory monitoring’ by local ‘stakeholders’ Different types of monitoring
Participatory ecological monitoring in Madagascar Biodiversity Locally endemic, rare, endangered species Species targeted for hunting Pressures Deforestation Burning Cut stumps Ox-cart tracks/paths Lemur traps etc. Narrow striped mongoose Giant Jumping rat Berthe’s mouse lemur Flat tailed tortoise
Pressure-state-response monitoring Organisation for Economic Co-operation and Development (OECD, 1993)
BirdLife International’s monitoring strategy • Update of IUCN Red List status (all bird species) and actions (Globally Threatened Birds) • Simple monitoring of Pressure, State and Response (including safeguard status) at all IBAs in network countries, supplemented by remote sensing (within and outside the network) • Population trend assessment for all Critically Endangered species, using a ‘species guardian’ approach • Assessment of trends in relative abundance of a set of common bird species using birders’ day lists (see www.worldbirds.org) • Regular update from network NGOs on membership, number and membership of affiliated Site Support Groups (SSGs), and self-evaluation against criteria of sustainability and stability
Successful monitoring programme • BTO Common Bird Census • Huge number of volunteers utilised to cover UK • Powerful monitoring programme • Informs intensive research and conservation action
….or is it? • Rare or elusive species • Low density populations • Dense and remote habitat • Difficult field conditions • Confounding factors
Survey techniques • Different survey techniques • Total counts • Index of abundance • Plot sampling • Distance sampling • Mark-recapture • Choice of technique depends on many scientific, biological and logistic factors
Total counts • Very small populations • Can ID individual animals • Territory mapping of song birds • Highly aggregated populations • Colonial nesting birds • Seals on a beach
Can we count all the animals in the population with certainty? • No, It is usually impossible! • Animals move, hide, look the same, inactive, too numerous, dense habitat • Census is a total count e.g. very small populations or seals on a beach during breeding • If you can’t do a total count then need to sample the population = survey
What is sampling? • A way of collecting observations • Arbitrary or natural • Random or systematic = representative • Independent • Replicated - more samples are better than a few • Extrapolate results to estimate total population size
Precision vs accuracy • Accuracy = reliability • ‘Bias’ is difference between estimate and true mean • Precision = repeatability • A precise estimate has low sample variance • Aim to remove/minimise bias in survey design and thus our estimate
Considerations for sampling design • Define the research question before you start • Distribution and approximate density • Density contours e.g. altitude, habitat gradient • Level of precision required • Resources available • Definition of survey area and sample units • Sampling must be representative
Index of abundance • Frequency of animals or sign per unit effort • ‘Relative’ abundance • Low density and elusive animals • Animals difficult to catch or mark or recapture • In dense habitat and remote areas • If have few resources
Index of abundance • Mist netting – bats, birds • Surveys of sign - elusive and nocturnal animals • Playback calls e.g. territorial birds and mammals • Pit fall traps – reptiles, amphibians, invertebrates • Camera-trapping – e.g. nocturnal mammals
10 Index of abundance 5 0 0 50 100 Population size Relationship between population size and index of abundance
Plot sampling • Quadrats, strips, circles • Assumption – can accurately count all animals in plot • D = N/A • Estimate of absolute abundance, i.e. population size
Plot sampling • High density and clustered populations • Sessile animals • Invertebrates • Small ground living reptiles • Plants • Sign e.g. dens, burrows, nests
Can we always detect all the animals in a plot with certainty? Use statistical methods to estimate probability of detection or capture
Distance sampling • Assumes probability of detection declines with increasing distance • Use a number of line or point transects to sample a population • Estimate detection probability by measuring distances
Distance sampling • Plot distances on a histogram • Number of animals detected declines with increasing distance • Probability of detecting animals declines with increasing distance
Detection probability • Assume all animals on the line are recorded • At 0m you have a probability of detection, p, of 1 • Use p, orthe detection function, to calculate the proportion of animals that are detected
Estimating abundance from a distance sampling survey number of observations % area sampled x detection probability N =
Distance sampling • Need to meet assumptions • Marine mammals • Primates, ungulates, whales • Birds • Reptiles, amphibians • Fish • Sign e.g. burrows, nests, dung
Mark-recapture • Mark-recapture allows you to estimate the probability of capturing animals • Uses the proportion of marked animals that are recaptured after release • Can estimate absolute abundance • Useful for animals that are trappable but are not readily detectable even close to the observer • Useful when information on other population parameters is needed
Mark-recapture N = n x M m Where, N = abundance M = number of individuals caught in 1st sample, marked then released n = number caught in 2nd sample m = number of marked individuals in 2nd sample
Mark-recapture • Usually requires high recapture rates • Requires large amounts of effort • High density populations • Small mammals • Reptiles • Amphibians • Fish
Mark-recapture • Other methods of capturing individuals • E.g. by hand, DNA profiling, camera-trap, individual recognition • Large mammals e.g. bears, tigers, whales • Even lions on tourist photos! • Number of assumptions that are hard to meet so abundance estimation can be difficult
What is a trend? • Changes in population size over time • Population dynamics of species vary widely • Driven by births, deaths and movement • Complex processes • Short term fluctuations occur in long terms trends
Analysing trends • Graphs • Express as % change over time e.g. 50% decline over 10 years • Linear regression analysis of abundance • Complex process models e.g. GAMs • Early warning system
What size of trend can you detect? • How able is a monitoring programme to detect a trend of a certain size over a certain time interval? • Depends on natural variability of population in time and space, sample sizes, survey design • Best to estimate at design stage • Power analysis • E.g. a monitoring programme has 80% power of detecting a 30% change over 10 years
Summary • Monitoring is vital tool in conservation and natural resource management • Pressure, state and response framework • Early warning system and evaluate effectiveness of conservation action and progress to targets • Identification of factors of decline • Variation in detection probability can confound monitoring data • Effective management of programme and long term funding is key • Combination of scientific and stakeholder participatory monitoring
Further reading • ‘Ecological methodology’ Krebs CJ • ‘Ecological census techniques’ Sutherland WJ • ‘Bird census techniques’ Bibby et al • ‘Sampling Rare or Elusive Species : Concepts, Designs, and Techniques for Estimating Population Parameters’ Thompson WL • ‘Introduction to Distance sampling’ Buckland et al (2001) • Monitoring matters: examining the potential of locally-based approaches. Special Issue: Biodiversity and Conservation, 14, No. 11, Oct 05 • www.monitoringmatters.org