Download
1 / 7
70 likes | 173 Views
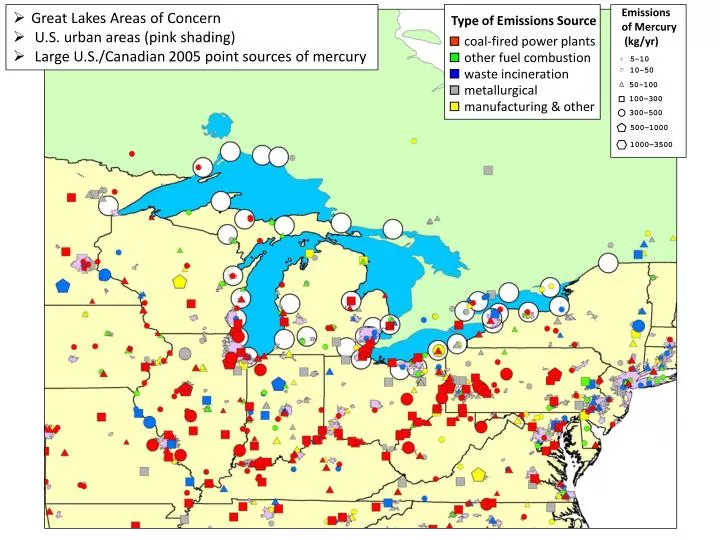
Great Lakes Areas of Concern U.S. urban areas (pink shading) Large U.S./Canadian 2005 point sources of mercury. Emissions of Mercury (kg/yr). 5-10. 10-50. 50-100. 100–300. 300–500. 500–1000. 1000–3500. Type of Emissions Source. coal-fired power plants. other fuel combustion.

E N D
Great Lakes Areas of Concern • U.S. urban areas (pink shading) • Large U.S./Canadian 2005 point sources of mercury Emissions of Mercury (kg/yr) 5-10 10-50 50-100 100–300 300–500 500–1000 1000–3500 Type of Emissions Source coal-fired power plants other fuel combustion waste incineration metallurgical manufacturing & other
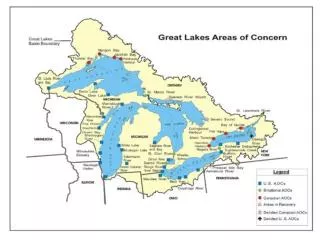
Atmospheric Hg Monitoring Sites 2005 Hg Emissions (kg/yr) St. Louis River and Bay AOC < 5 5-10 10-50 50-100 100–300 300–500 500–1000 1000–3000 Type of Emissions Source coal-fired power plants other fuel combustion waste incineration metallurgical manufacturing & other
2005 Hg Emissions (kg/yr) Ispat Inland Steel Mining Minorca < 5 US Steel Minntac 5-10 10-50 MN Power Laskin 50-100 100–300 US Steel Keewatin Taconite 300–500 MN Power Boswell Hibbing Taconite United Taconite Fairlane Plant 500–1000 1000–3000 Georgia Pacific Type of Emissions Source coal-fired power plants other fuel combustion waste incineration metallurgical MURPHY OIL USA INC. SUPERIOR REFINERY manufacturing & other
Some of the issues to think about… • Mercury Emissions, especially local and regional • “current” (2005, 2008, 2011…) • Historical (emissions in the past may have been significantly different, e.g., incinerators?) • This is the primary area that I’d need help… we have to get this right! • “Receptor” details, i.e., what points and/or areas do to have model-estimated deposition? • Watershed(s) and sub-watersheds • Lake surface • River? • Interpretation of results? • Comparison against mercury “inventory” in AOC (i.e., in sediments and soil)? • Comparison against deposition elsewhere? • Time trend of deposition? • Groundtruthing the results • MDN (Hg wet deposition) sites in the region • Ambient Hg air concentration data? • Meteorological modeling data to drive local/regional dispersion simulations • Might have to carry out initial analyses using relatively coarse data • If higher-resolution data are needed, these might have to be generated
Local mercury deposition impacts can be dramatically higher than impacts further away from the source • Distance results averaged over all directions: • Areas generally downwind of the source will have higher deposition fluxes than the averages shown here. • Areas generally upwind will have lower fluxes.