Download
1 / 23
230 likes | 304 Views
Quantitative Assessment of the Accuracy of Spatial Estimation of Impervious Cover. Anna Chabaeva Daniel Civco James Hurd Jason Parent. Department of Natural Resources Management & Engineering The University of Connecticut U-4087, Room 308, 1376 Storrs Road Storrs, CT 06269-4087. Objectives.

E N D
Quantitative Assessment of the Accuracy of Spatial Estimation of Impervious Cover Anna ChabaevaDaniel CivcoJames HurdJason Parent Department of Natural Resources Management & Engineering The University of Connecticut U-4087, Room 308, 1376 Storrs Road Storrs, CT 06269-4087
Objectives Calculate percent imperviousness for52 towns in Connecticut and New York on Tract Level with Subpixel Classification Impervious Surface Analysis Tool (ISAT)Population Density and Land Use-based Regression Model using National Land Cover Data 2001 Comparepredicted amount of imperviousness to highly accurate and precise planimetric data
Rooftops Transportation System • Roads • Sidewalks • Driveways • Parking lots • Buildings • Pools • Patios Impervious Surface (IS) The imprint of land development on the landscape:
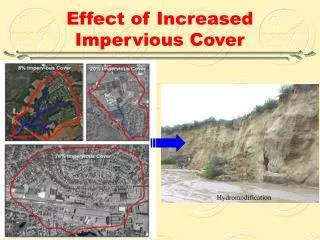
Why Is Impervious Surface Important? Urbanization Building density increases Population density increases Waterborne waste increases Impervious area increases Drainage system modified Water demand rises Water resource problem Urban climate changes Groundwater recharge reduces Stormwater quality deteriorates Runoff volume increases Flow velocity increases Receiving water quality deteriorates Base flow reduces Peak runoff Rate increases Lag time and time base reduces Pollution control problems Flood control problems
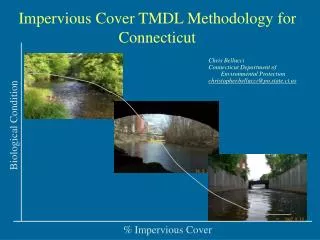
100 90 80 70 60 50 40 30 20 10 0 DEGRADED WATERSHED IMPERVIOUSNESS (%) IMPACTED PROTECTED Influence of Impervious Surfaces on Water Quality
Interpretive Approach • Digitizing • Point sampling (Cover Tool method) • Spectral Approach • Sub-pixel Classification • Artificial Neural Networks • Classification and Regression Tree (CART) • Normalized Difference Vegetation Index (NDVI) • Vegetation-Impervious surface-Soil (VIS) model • Modeling Approach • Population Density-based • Impervious Surface Analysis Tool (ISAT) • Regression Model Impervious Surface Measurement Methods
Impervious Surface Measurement Methods • Interpretive Approach • Digitizing • Point sampling (Cover Tool method) • Spectral Approach • Sub-pixel Classification • Artificial Neural Networks • Classification and Regression Tree (CART) • Normalized Difference Vegetation Index (NDVI) • Vegetation-Impervious surface-Soil (VIS) model • Modeling Approach • Population Density-based • Impervious Surface Analysis Tool (ISAT) • Regression Model
Study Area NY CT
Data Requirements All datasets are in State Plane feet, NAD83 coordinates • Census tracts 2000 data • Planimetric data • National Land Cover Data (NLCD) 2001 • Landsat ETM+ data
Census tracts Town of Groton, CT Original (green) and edited (red) tract data Census Tract 2000 Data 82 tracts Obtained from: Cartographic Boundaries section of the U.S. Census Bureau
Planimetric Data Obtained from: Town municipalities Updated using 2004 CT DOQQs Planimetric data Town of Groton, CT
National Land Cover Data (NLCD) 2001 100 x 100 feet
NLCD Impervious Cover Landsat ETM Imagery NLCD Imperviousness 0% 100% http://www.mrlc.gov/pdfs/July_PERS.pdf
Land Use Land Cover Grid Polygon Shapefile Set of Coefficients Impervious Surface Analysis Tool (ISAT) http://www.csc.noaa.gov/crs/cwq/isat.html
Validation Data 82 CT tracts Calibration Data 221 NY tracts Regression Model where - b1 is the constant term - b2 is the coefficient for population density - biare those for percentage of land cover category area within the tract - PopDen is the Population density - %Ai are the percent of the land cover category area within the tract
Sub-pixel Classification Tract IS Estimation Actual Imperviousness NLCD Imperviousness Town of Groton, CT 82 tracts R2 = 0.95 RMSE = 5.65
ISAT Tract IS Estimation Actual Imperviousness ISAT Imperviousness Town of Groton, CT 82 tracts R2 = 0.93 RMSE = 5.48
Regression Tract IS Estimation Actual Imperviousness Regression Imperviousness Town of Groton, CT 82 tracts R2 = 0.93 RMSE = 4.56
ETIS Land Use Land Cover Grid Polygon Shapefile Custom Set of Coefficients Population Density Set of Coefficients Land Cover Change
ETIS Predicted Percent Imperviousness for Connecticut Census Tracts
Conclusions Population density and landcover-based method the highest accuracy ISAT and population density and landcover-based method easy to implement easy to modify and recalibrate homogeneous (lumped) measure Subpixel method spatially explicit
Quantitative Assessment of the Accuracy of Spatial Estimation of Impervious Cover Anna Chabaevaanna.chabaeva@uconn.eduDaniel CivcoJames Hurd Jason Parent Thank you! Department of Natural Resources Management & Engineering The University of Connecticut U-4087, Room 308, 1376 Storrs Road Storrs, CT 06269-4087