Download
1 / 51
520 likes | 669 Views
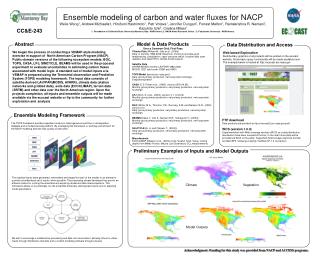
NACP. Convergence and synthesis of regional top-down and bottom-up estimates of CO 2 flux estimates: Results from the North American Carbon Program Midcontinent Intensive (MCI) regional study.

E N D
NACP Convergence and synthesis of regional top-down and bottom-up estimates of CO2 flux estimates: Results from the North American Carbon Program Midcontinent Intensive (MCI) regional study Kenneth Davis1, Arlyn Andrews2, Varaprasad Bandaru3, F. Jay Breidt4, Dan Cooley4, Scott Denning4, Liza Diaz1, Kevin Gurney5, Ram Gurung4, Linda Heath6, R. Cesar Izaurralde3, Thomas Lauvaux1, Zhengpeng Li7, Shuguang Liu7, Natasha Miles1, Stephen Ogle4, Scott Richardson1, Andrew Schuh4, James Smith6, Colm Sweeney2, Tristram West3 1The Pennsylvania State University, 2NOAA ESRL, 3Pacific Northwest National Laboratories, 4Colorado State University, 5Arizona State University, 6USDA Forest Service, 7EROS Data Center RECCAP meeting, 26 May, 2011, Shepherdstown, West Virginia, USA
outline • Objectives • Results • Inventory • Inversion • Comparison and synthesis • Work to come
Atmospheric Inversions CO2 CO2 CO2 CO2 CO2 CO2 C C Inventories NACP Midcontinent Intensive (MCI) • To what degree can we demonstrate convergence in regional flux estimates using top-down and bottom-up methods?
Evolution of the MCI • 1999 US Carbon Cycle Science Plan (Sarmiento and Wofsy) proposed regional atmospheric inversions. • 2002 white paper by Pieter Tans proposed the U.S. midcontinent as a good experimental site – agricultural fluxes are known because of harvest/inventory data. • 2006 Midcontinent Intensive (MCI) science plan (Ogle et al) spelled out the objectives of this contribution to the North American Carbon Program (NACP). • Field work, 2005-2009. Analyses are at hand! • The primary objective of the NACP MCI is to test of our ability to achieve convergence of “top-down” and “bottom-up” estimates of the terrestrial carbon balance of a large, sub-continental region.
Experimental design • Dense, tower-based greenhouse gas measurement network • Relatively simple terrain and dense meteorological data These yield our best chances to derive robust flux estimates using atmospheric inversions. • Excellent “bottom-up” flux estimates from inventory methods This provides the test for the atmospheric inversion methodology.
Cropland Carbon:Estimation based on stock change on cropland fields and includes key lateral flows in harvested grain and eroded C. Eroded C Δ SOC Yield Total Δ Dead Aboveground Litter C Δ Dead Belowground Litter C Δ Live Belowground C (0) Δ Live Aboveground C (0) West et al., 2011; Ogle et al., 2010
Forest C Forest C Forestland Carbon:Estimation based on stock change on forest land stands and includes key lateral flow of harvested woody products. Eroded C Eroded C Δ SOC Δ SOC Timber Harvest Timber Harvest Δ Dead Aboveground CWD & Litter C Δ Dead Aboveground CWD & Litter C Δ Dead Belowground CWD & Litter C Δ Dead Belowground CWD & Litter C Δ Live Aboveground C Δ Live Aboveground C Δ Live Belowground C Δ Live Belowground C Smith et al., 2003; EPA, 2009
PDF PDF Inventory Uncertainty Assessment Input Uncertainies* Simulation Model Scaling Uncertainty Results 95% Confidence Interval *For example: -Crop yield data. -Yield to carbon conversion coefficient. -Fertilizer application rate. Structural Uncertainty Ogle et al., Global Change Biology, 2010
Food (Human) Seed production Exported C Fiber (Cotton) Fuel (Ethanol & Biodiesel) Processing waste Beginning C stock (15) Carryover Carbon Stock Cropland Carbon Budget for 2008 “Where does carbon in crops ultimately end up?” “Can we account for all carbon and balance the budget?” Decomposition 329 NPP 595 7 18 147 2 1 Crop carbon Harvested C stock (255) 39 3 255 10 Non-grain C stock (3) Net soil C change 47 Available C Stock for 2008 (258) 15 carryover from previous year (2007) Imported C 3 carryover to following year (2009) 18 United States Cropland Carbon Budget for 2008 West et al, 2011 Feed (Livestock)
Food (Human) Seed production Exported C Fiber (Cotton) Fuel (Ethanol & Biodiesel) Processing waste Beginning C stock (15) Carryover Carbon Stock Cropland Carbon Budget for 2008 What part of this budget does the atmosphere see? Included in Vulcan fossil fuel estimates Decomposition 329 NPP 595 Outside budget boundaries 7 18 147 2 1 Crop carbon Harvested C stock (255) 39 3 255 10 Non-grain C stock (3) Net soil C change 47 Available C Stock for 2008 (258) 15 carryover from previous year (2007) Imported C 3 carryover to following year (2009) 18 United States Cropland Carbon Budget for 2008 West et al, 2011 Feed (Livestock)
National-scale agricultural inventory Harvested biomass is transported out of the MCI region. Agriculture is a strong sink from the regional atmospheric perspective MCI domain West et al, 2011
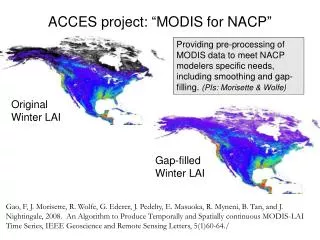
MCI inventory estimates: Forest and crop yield dominate Units are Gg C per ½ degree pixel.
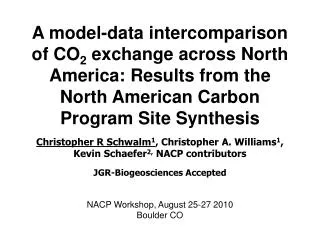
(Gurney et al. 2009) Units are Gg C per ½ degree pixel.
MCI inventory summary • Carbon sink associated with cropland due to carbon fixation through photosynthesis and lateral transport of harvested grain (West et al. 2011) dominates. • Uncertainties are dominated by crop yield data and crop yield to C coefficients. (Data are relatively precise, but contribute to large fluxes.) • Agricultural uncertainties are highly coherent across space.
CO2 Concentration Network: 2008 INFLUX, 2010-2012 Midcontinent intensive, 2007-2009 Gulf coast intensive, 2013-2014
MCI Tower-Based CO2 Observational Network Corn-dominated sites
MCI 31 day running mean daily daytime average CO2 Mauna Loa • Large differences in seasonal drawdown, despite nearness of stations. • 2 groups: 33-39 ppm drawdown and 24 – 29 ppm drawdown. Tied to density of corn. Miles et al, in review
Synoptic variability in boundary-layer CO2 mixing ratios: Daily daytime averages Daily differences from day to day (or site to site – not shown) as large at 30 ppm. Miles et al, in review
Air Parcel wind wind Sinks Air Parcel Air Parcel Sources Sample Sample Inversion Toolbox: “Forwards” system Boundary conditions: CO2: NOAA aircraft profiles and Carbon Tracker Met: NCEP meteorology Atmospheric transport model: (WRF, 10km) Prior flux estimate: (SiB-Crop and CASA) Network of tower-based GHG sensors: (9 sites with CO2) Lauvaux et al, in prep, A
Inversion Toolbox, continued • Lagrangian Particle Dispersion Model (LPDM, Uliasz). • Determines “influence function” – the areas that contribute to GHG concentrations at measurement points. • Influence functions include the lateral boundaries. Inversion solves for both surface flux and boundary condition corrections. • Bayesian matrix inversion. Weekly time step. 20km resolution. Experiment with coherence of solution in space: Default 100 km. Lauvaux et al, in prep, A
Inversion method (graphic) Estimated together Enhance uncertainty assessment by experimenting with the prior and the uncertainty estimates (model-data, prior) and examining the impact on the derived fluxes.
CO2 boundary condition adjustment CT vs. NOAA aircraft profiles Lauvaux et al, in preparation, A
Spatial pattern of NEE is not overly sensitive to the prior. Prior flux estimate Posterior flux estimate Units are TgC/degree2, Jun-Dec07 Lauvaux et al, in preparation, A
Regionally and time integrated C flux uncertainty assessment Experiments with the PSU inversion include varying the: - prior flux - prior flux uncertainty (magnitude and spatial correlation) - model-data error (magnitude and temporal correlation) - boundary condition temporal persistence. Net flux estimate is fairly robust to the assumptions made in the inversion. Lauvaux et al, in preparation, A
Impact of observational network: Tower removal experiments Prior flux Posterior flux with all sites Regional integral is fairly robust to tower removal. Spatial patterns are quite sensitive to tower removal. Posterior without “corn” sites Posterior with only “corn” sites Lauvaux et al, in prep, B
Spatial correlation in [CO2] residuals for two transport models: Signs of oversampling? Carbon Tracker Growing Season 2007 • CT 2007 shows that sites close to each other and with the same vegetation are the only ones highly correlated (WBI-Kewanee). • Using the same fluxes but a different atmospheric transport model (WRF) to predict [CO2] produces substantially higher spatial correlations. WRF-CASA Growing Season 2007 Daily daytime averages. Diaz et al, in prep
Total uncertainty is reduced. Inventory and inversions bring independent samples of the same quantity. Model for RECCAP best estimates. Cooley et al, in preparation
Cooley et al., in preparation Ogle et al., in preparation
Conclusions • Regional C flux inverse estimates for the MCI appear to converge with inventory estimates. • Regional C flux inverse estimates for the MCI are fairly robust to assumptions. • Regional sums of NEE do not require a very dense observational network, but spatial patterns are highly sensitive to the network. • Differences across inversion systems (transport, structure of inversion) have not yet been assessed.
What’s next? MCI synthesis papers MCI atmospheric transport uncertainty analyses INFLUX and Gulf coast intensives
CO2 Concentration Network: 2008 INFLUX, 2010-2012 Midcontinent intensive, 2007-2009 Gulf coast intensive, 2013-2014
INFLUX (Indianapolis FLUX) Project Goals: • Compare top-down emission estimates from aircraft and tower-based measurements with bottom-up emission estimates from inventory methods (include CO2 – fossil and biological, and CH4) • Quantify uncertainties in the two approaches
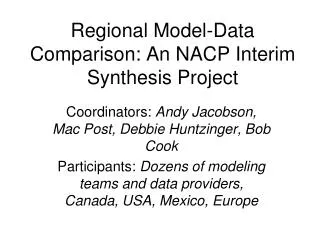
Why Indianapolis? • Medium-sized city, with fossil fuel CO2 emissions of ~3.4 MtC yr-1 • Located far from other metropolitan areas, so the signal from Indianapolis can be isolated with relative ease • Flat terrain, making the meteorology relatively simple 1 View of Indianapolis from the White River (photo by Jean Williams)
Tower-based measurements: continuous • Current: continuous measurements of CO2 at two sites • Planned • Two sites measuring CO2/CO/CH4 • Three sites measuring CO2/CO • Three sites measuring CO2/CH4 • Four sites measuring CO2
Tower locations • Sites 1 and 2 are currently measuring CO2. • Sites 3 through 12 are planned, with tentative locations shown. • Mixture of continuous CO2, CH4 and CO sensors, and flask 14CO2 data. 2 1 1
Purdue airborne sampling (budget flux estimates, source ID, transport test) Mays, K. L., P. B. Shepson, B. H. Stirm, A. Karion, C. Sweeney, and K. R. Gurney, 2009. Aircraft-Based Measurements of the Carbon Footprint of Indianapolis, Environ. Sci. Technol., 43, 7816-7823
Publications in press or published EPA (2009) Inventory of U.S. greenhouse gas emissions and sinks: 1990-20067 http://www.epa.gov/globalwarming/ publications/emissions, United States Environmental Protection Agency, Washington, D.C. Gurney, K.R., D.L. Mendoza, et al. (2009). High resolution fossil fuel combustion CO2 emission fluxes for the United States. Environmental Science and Technology 43: 5535-5541. Ogle, S.M., F.J. Breidt, M. Easter, S. Williams, K. Killian, and K. Paustian. 2010. Scale and uncertainty in modeled soil organic carbon stock changes for US croplands using a process-based model. Global Change Biology 16:810-822. Smith, J.E., L. Heath, J.C. Jenkins 2003. Forest volume-to-biomass models and estimates of mass for live and standing dead trees of U.S. forests. Gen. Tech. Rep. NE-298. Newtown Square, PA: U.S. Department of Agriculture, Forest Service, Northeastern Research Station. 57 p. West, T.O., N. Singh, G. Marland, B.L. Bhaduri, A. Roddy. 2009. The human carbon budget: An estimate of the spatial distribution of metabolic carbon consumption and release in the United States. Biogeochemistry 94: 29-41, DOI 10.1007/s10533-009-9306-z. West, T.O., V. Bandaru, C.C. Brandt, A.E. Schuh, S.M. Ogle. 2011. Regional Uptake and Release of Crop Carbon in the United States. Biogeosciences, In review.
Publications in review or prep • Richardson et al, cavity ring down spectroscopic CO2 field measurements • Stephens et al, LI-820 based, well-calibrated CO2 field measurements • Miles et al, MCI atmospheric CO2 observations and the impact of the corn belt • Lauvaux et al, A, Regional flux inversion methodology applied to the MCI, 2007. • Lauvaux et al, B. Sensitivity of regional MCI inversion to tower sampling density • Diaz et al, Analysis of atmospheric CO2 model-data residuals for the MCI