Download

1 / 17
170 likes | 300 Views
What Makes a Function Linear. Lesson 1.3. What Is A Line?. Check out this list of definitions or explanations to the question Define Line Today we look at what makes a function linear. Rate of Change. Consider example y = 3x + 5 We note the rate of change is constant

E N D
What Makes a Function Linear Lesson 1.3
What Is A Line? • Check out this list of definitions or explanations to the question • Define Line • Today we look at what makes a function linear.
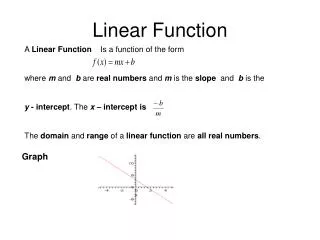
Rate of Change • Consider example y = 3x + 5 • We note the rate of change is constant • This means it is a linear function • It graphs as a straight line y=3x + 5
Plotting Points on the Calculator • Use Data Matrix on Calculator • Choose APPS, then 6 Data/Matrixthen NEW
Starting Up • Choose DATA • Give it a variablename for savingin memory
Cursor must be here Enter formula here Entering Data • Enter numeric values in the cells • Enter a formula at the top • Using column name
Viewing Data • Note the results of the formula • We can do further calculations • We can also plot these points
Choose line type Specify the columns for the X and Y values Plotting Data • Choose F2 for Plot SetupScreen • Then F1 for Define
Plotting Data • Goto the Y= Screen to turn off any functions there • Then specify ZoomData • This fits the window to the limits of the data
Plotting Data • Note the graph includes the points we had in the data matrix • It is a line-graph, the points are represented by boxes
Another Example • Consider the following table of values • Note the value of for any two pairs of values
Example From Text $20,000 • See Example 2, pg. 19 • Formula used for depreciation Value of equipment = original value – $4000 * number of years • To generalize:Dependent Qty = startValue + rateOfChange * independentQuantity
Family of Linear Functions • Slope = Rate of Change View TI Nspire filewhich demonstrates the slope-intercept formula y=3x + 5 • Slope = m = 3 • y-intercept = b = 5
Family of Linear Functions • Calculating slope with two ordered pairs (X2, Y2) • (X1, Y1) • Given two ordered pairs, (7,5) and (-3,12). What is the slope of the line through these two points?
Warning • Not all functions which appear linear will actually be linear!! • Consider the set of ordered pairs • Graph them • Decide whether graphis linear • Check slope for differentpairs
Results • Graph appearsstraight • But …rate of change is not a constant
Assignment • Lesson 1.3 • Page 24 • Exercises1 – 5, 7, 9, 13, 15, 19, 21, 23