Download

1 / 7
70 likes | 142 Views
Preliminary Average Class Size Data. The NYCDOE reports on class size twice a year: a preliminary report in November and an updated report in February.

E N D
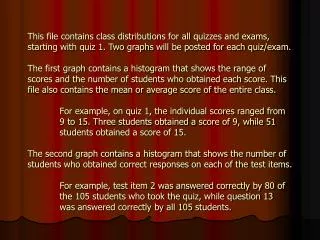
Preliminary Average Class Size Data • The NYCDOE reports on class size twice a year: a preliminary report in November and an updated report in February. • This Preliminary report is based on early data in ATS and STARS – schools’ register and scheduling systems – from the October 26, 2012 unaudited register. • Historically, October 31st is the date used for the register. When October 31st does not fall on a school day, the last school day in session prior to October 31st is used. Due to Hurricane Sandy, class was not in session on October 31st. Therefore, October 26th – the last school day prior to Hurricane Sandy – was used for the register. • Class size summaries report the number of students (“seats filled”) and number of sections in grades K-8 and core courses in Middle Schools and High Schools. • School-level data from ATS and STARS from October 26th are pending review and updated throughout the year. Middle Schools and High Schools typically finalize their schedules in STARS at the end of each term. • Historically, early data analysis includes long-term absences, incomplete scheduling data, and other characteristics that are updated by schools in the February report. • All school-level and citywide data and trends from this report must be considered preliminary in light of these known issues. 2012-2013 Preliminary Class Size Report
Class Size Methodology • Middle Schools and High Schools use STARS1 to identify courses by the subject, content and nature of the course. • The process for collecting information from High Schools and Middle Schools about their courses through STARS has been updated in FY13. • Schools now categorize each course into specific subjects by department • Schools must now indicate details about each course, such as delivery mechanism, course duration, position in sequence, and rigor • Schools distinguish online courses and other characteristics • This information is used to identify courses as “core” or “non-core” • Updates to course coding in STARS allow the DOE to: • Further standardize the identification of core courses2 in the class size report • Identify college and career readiness courses for Progress Report calculations • Report the student growth component of the teacher evaluations per state requirements 1In 2011-12, almost all Middle Schools had moved to the STARS scheduling system. Previously, the transition to STARS resulted in somewhat inconsistent data as principals used the system for the first time. In the longer term, this change will result in more accurate reporting of core and elective courses. 2Core courses are defined as credit bearing courses within the four major content areas: English, science, math, and social studies. These courses are mandated as part of the graduation sequence and electives students take to satisfy graduation requirements. 2012-2013 Preliminary Class Size Report
Class Size Context • In 2012-13, overall schools’ tax levy budgets were held flat. Some schools may have experienced adjustments in their budgets depending on changes in their student and staff composition. • The number of ICT classes continues to grow, while the number of General Education and Self Contained Classes has decreased. • Independent of class size trends, more students are being served by two teachers in the class. For example, a school with one General Education class with 30 pupils will show a class size of 30. If, in the next year, this one class changes to an ICT class with 30 pupils and two teachers, their class size remains unchanged, but the ratio of pupils to teachers is now 15:1, not 30:1. • From FY12 to FY13 the Pupil-Teacher Ratio (PTR) for GE and ICT decreased by 1.4 students per teacher. This decrease is attributable to the increase in ICT programs as the additional teacher in each of these classes brings down the PTR. • New academic policy requires seniors to take five and a half hours of instruction per day, even if they have fulfilled graduation requirements. This change has resulted in an increase in total courses taken by students. *In previous years, accurate reporting of ICT courses required a manual matching process to make sure single sections with two teachers were not being reported as two different sections. The accurate reporting of ICT courses continues to improve significantly due to updates to STARS and an increased training initiative guiding support networks and schools. 2012-2013 Preliminary Class Size Report
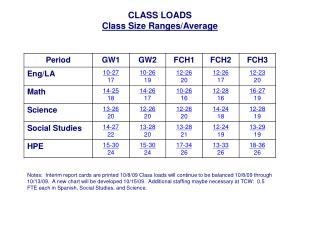
Class Size Context (continued) • Citywide, average class size1 increased by 1.6% from 26.3 to 26.7, an increase of 0.4 students per class • Elementary School class sizes increased by 0.4 studentsfrom 24.4 to 24.8 average students per class • Middle School class sizes increased by 0.3 studentsfrom 27.0 to 27.3 average students per class • High School class sizes increased by 0.6 studentsfrom 26.3 to 26.9 average students per class • Nearly half of all schools had no or minimal2 increases in class size • 757 schools either decreased or had minimal increases in class size • 776 schools experienced increases in class size • Fewer Middle Schools had an increase in class size compared to Elementary Schools and High Schools. 1 Citywide changes are based on General Education and Integrated Co-Teaching (ICT) students and sections. 2 Minimal increases are defined as any increase that is less than 1%. 2012-2013 Preliminary Class Size Report
Class Size – Summary Data • 2012-13 Average Class Size - Preliminary • (Based on 10/26/2012 unaudited register and scheduling data; audited data available end of January) * Official class, except for High School. Excludes Self-Contained Special Education classes. ICT is Integrated Co-teaching, with two teachers sharing a class that combines General Ed and students with disabilities. ** Includes 9th grades residing in Jr. High Schools (i.e., 6th-9th grades) and 5th grade in Middle schools with a 5th grade. *** High School courses are all core academic classes, as reported in STARS. 2012-2013 Preliminary Class Size Report
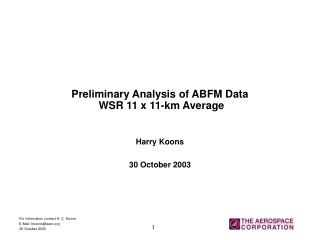
Class Size – Change over time(General Education and ICT classes only) (1) Starting in FY08, High School average class size methodology was no longer comparable to historical class data. In FY09, changes to ICT reporting further shifted methodology. Class size information for middle school academic courses became available for the first time in FY09. Starting in FY13 Middle and High School core courses are defined centrally, rather than being indicated as core by schools. 2012-2013 Preliminary Class Size Report