Download
1 / 16
160 likes | 266 Views
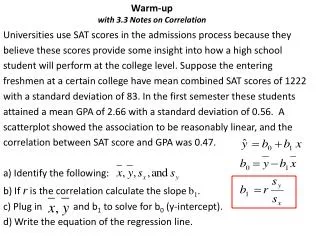
Warm-up with Multiple Choice Practice on 3.1 to 3.3. A scatterplot demonstrates the positive correlation between the number of churches and the number liquor stores in a growing town over the years. 1)The correlation appears to be a strong. Explain why even

E N D
Warm-upwithMultiple Choice Practice on 3.1 to 3.3 A scatterplot demonstrates the positive correlation between the number of churches and the number liquor stores in a growing town over the years. 1)The correlation appears to be a strong. Explain why even though there appears to be a strong correlation, why the two variables are not related. 2) Another scatterplot demonstrates a strong correlation between the number of people wearing shorts and the number of people eating ice cream on different days at the beach. What is the lurking variable?
Answers to Statistics H.W. 3.2 P#3 and 5, E # 9 and 11 P3. As the school year progresses the student’s eraser weighs less (gets smaller). The eraser originally was 91.5 g (y-intercept) and it decreases at a rate of about 1 gram/80 days (slope). P5. a) The explanatory variable is the student/faculty ration. The response variable is the % of alumni giving. b. Two points on the line are (10, 35) and (15, 25). These are not data points but points on the line itself. c. The y-intercept has no use because there would not be a situation where the student to faculty ratio would be zero. d. The predicted giving rate would be 23% for a 16 faculty/student ratio. There will be a large error because the values are not clustered closely to the line. e. Actual - Predicted = 9 - 8 = 1 for university with highest faculty/student ratioActual – Predicted = 56 – 39 = 17 for university with highest giving rate f. Actual – Predicted = 32 – 44 = - 8 g. The prediction error would be positive.
Statistics Answers continued E #9 and 11 E 9. a. I. – E, II. – C, III – A, IV – D, V – B b. I – A, II – E, III – B, IV – D, V - C E 11. a. Theslope is about 2.5 inches a year b. The height of boys tend to be 2.5 inches/ year from ages 2 to 14. c. Depending on the point plugged in, if age 3 was plugged in the resulting equation would be height = 2.5(years) + 31.5 D. A y-intercept of 31.5 would mean that the median height of a newborn is 31.5 inches.
A.P. Statistics directions for Quiz • Answer every problem in complete sentences; The most expensive house is … • Answer on a separate sheet of paper, you can staple it to your quiz paper. • For 2e, I want to see how you calculate the residual. • For 2 g. create a table showing fat, calories (actual), predicted and residuals, then show the sum of the residuals is zero. • When you finish, flip over your quiz and paper (make sure both have your name) in front of you and work on the 3.1 to 3.3 Multiple Choice Practice. • Work silently until I let you know everyone is done with their quiz. • Once everyone is done with the quiz you, and your table can discuss the 3.1 to 3.3 Multiple Choice.
Statistics Extra Practice with linear regression 1) Does a person’s muscle mass decrease with age? Explanatory Var. Response Var. 2) Using your graph paper, plot these on a scatterplot and identify the point that represents age 71 and muscle mass is 82.
Practice Using Muscle Mass vs. Age Data to find linear regression step-by-step Sum: ____ ______ ______ ______ _______ ____ Mean: ___ ______
Statistics Directions • We will be finishing the rest of the Linear Regression worksheet after the quiz next class. • Now you will complete the multiple choice portion of the worksheet. • Complete what you can silently by yourself for the first 10 minutes. • Then work with your table mates to select the right answers. • Put your final right answers on a piece of paper to turn in for a participation grade. • You can use your notes, textbook and ask me questions.
Multiple Choice Practice on 3.1 to 3.3 • Submit a sheet of paper with your table’s agreed upon answers for a participation grade. • This will be graded for accuracy. • You may ask me questions.
Check to see if your vocabulary/formula list is completeQuiz is Tuesday 10/25 for A.P. Stats and Thursday 10/27 for Stats 3.1 – scatterplot, bivariate, linearity, clusters, outliers, trend, strength, generalization 3.2 – slope, y-intercept, predictor (explanatory variable), predicted (response variable), residual, interpolation, extrapolation, prediction error, least squares regression line (regression line), sum of squared errors (SSE) 3.3 – correlation, regression toward the mean, line of means, regression effect, regression toward the mean Know formulas for: 1) slope in LSRL, 2) LSRL equation 3)SSE, 4) r (correlation coefficient), 5) r2 (coefficient of determination) 6) slope from the correlation and SDs
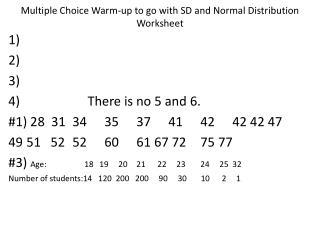
Answers to Multiple Choice 1)d 2)c 3)a 4)c 5)c 6)b 7)c 8)b 9)e
H.W. Assignments A.P. Statistics – 3.3 E #27, 34, 37, and 38 Bring graph paper for activity next class. ____________________________________________ Statistics – 3.3 E # 27 and 34 Be prepared for Quiz on 3.1 to 3.3. Bring calculator notes.