Download
1 / 1
10 likes | 65 Views
Contrasting impact of forestry-drainage on CO 2 balance at two adjacent peatlands in Finland. Lettosuo fen. Arctic circle. SWEDEN. RUSSIA. Lohila A 1* ., Minkkinen K 2 ., Penttilä T 3 ., Launiainen S 3 ., Koskinen M 2 ., Ojanen P 2 ., Laurila T 1 .

E N D
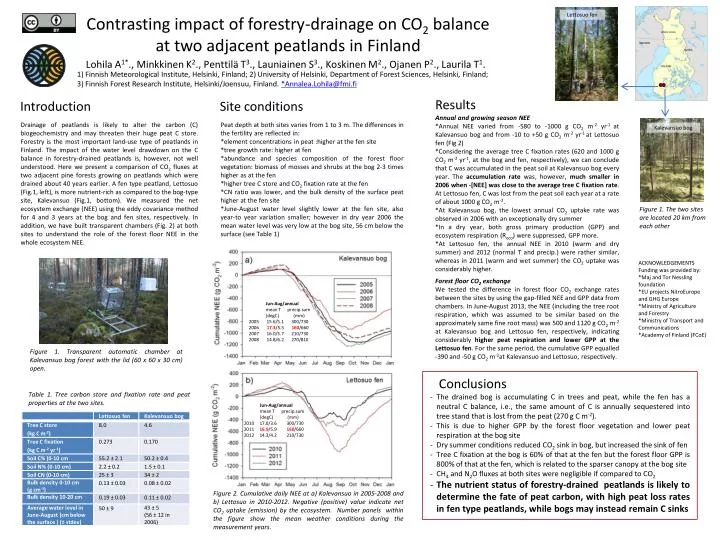
Contrasting impact of forestry-drainage on CO2 balance at two adjacent peatlands in Finland Lettosuo fen Arcticcircle SWEDEN RUSSIA Lohila A1*., Minkkinen K2., Penttilä T3., Launiainen S3., Koskinen M2., Ojanen P2., Laurila T1. 1) FinnishMeteorological Institute, Helsinki, Finland; 2) University of Helsinki, Department of Forest Sciences, Helsinki, Finland; 3) FinnishForestResearch Institute, Helsinki/Joensuu, Finland. *Annalea.Lohila@fmi.fi FINLAND Results Introduction Siteconditions Annual and growingseason NEE *Annual NEE variedfrom -580 to -1000 g CO2 m-2 yr-1 at Kalevansuobog and from -10 to +50 g CO2 m-2yr-1 at Lettosuo fen (Fig 2) *Considering the averagetree C fixationrates (620 and 1000 g CO2 m-2yr-1, at the bog and fen, respectively), wecanconcludethatC was accumulated in the peat soil at Kalevansuo bog every year. The accumulation rate was, however, much smaller in 2006 when -[NEE] wasclose to the averagetree C fixationrate. At Lettosuo fen, C waslostfrom the peatsoileachyear at a rate of about 1000 g CO2m-2. *At Kalevansuobog, the lowestannual CO2uptakeratewasobserved in 2006 with an exceptionallydry summer *In a dryyear, bothgrossprimaryproduction (GPP) and ecosystemrespiration (Reco) weresuppressed, GPP more. *At Lettosuo fen, the annual NEE in 2010 (warm and dry summer) and 2012 (normal T and precip.) wererathersimilar, whereas in 2011 (warm and wet summer) the CO2uptakewasconsiderablyhigher. Forestfloor CO2exchange Wetested the difference in forestfloor CO2exchangeratesbetween the sitesbyusing the gap-filled NEE and GPP data fromchambers. In June-August 2013, the NEE (including the treerootrespiration, whichwasassumed to besimilarbased on the approximatelysamefinerootmass) was 500 and 1120 g CO2 m-2 at Kalevansuobog and Lettosuo fen, respectively, indicatingconsiderablyhigherpeatrespiration and lower GPP at the Lettosuo fen. For the sameperiod, the cumulative GPP equalled -390 and -50 g CO2m-2at Kalevansuo and Lettosuo, respectively. Drainage of peatlands is likely to alter the carbon (C) biogeochemistry and maythreatentheirhugepeat C store. Forestry is the mostimportantland-usetype of peatlands in Finland. The impact of the waterleveldrawdown on the C balance in forestry-drainedpeatlands is, however, notwellunderstood. Here wepresent a comparison of CO2fluxes at twoadjacentpineforestsgrowing on peatlandswhichweredrainedabout 40 yearsearlier. A fentypepeatland, Lettosuo (Fig.1, left), is morenutrient-rich as compared to the bog-typesite, Kalevansuo(Fig.1, bottom). Wemeasured the netecosystemexchange (NEE) using the eddycovariancemethod for 4 and 3 years at the bog and fensites, respectively. In addition, wehavebuilttransparentchambers(Fig. 2) at bothsites to understand the role of the forestfloor NEE in the wholeecosystem NEE. Peatdepth at bothsitesvariesfrom 1 to 3 m. The differences in the fertilityarereflected in: *elementconcentrations in peat :higher at the fensite *treegrowthrate: higher at fen *abundance and speciescomposition of the forestfloorvegetation:biomass of mosses and shrubs at the bog2-3 timeshigher as at the fen *highertree C store and CO2fixationrate at the fen *CN ratiowaslower, and the bulkdensity of the surfacepeathigher at the fensite *June-Augustwaterlevelslightlylower at the fensite, alsoyear-toyearvariationsmaller; however in dryyear 2006 the meanwaterlevelwasverylow at the bogsite, 56 cm below the surface (seeTable 1) Kalevansuobog ACKNOWLEDGEMENTS Fundingwasprovidedby: *Maj and Tor Nessling foundation *EU projectsNitroEurope and GHG Europe *Ministry of Agriculture and Forestry *Ministry of Transport and Communications *Academy of Finland (FCoE) Jun-Aug/annual mean T precip.sum (degC) (mm) 2005 15.6/5.1 300/730 2006 17.3/5.5 160/660 2007 16.0/5.7 210/730 2008 14.8/6.2 270/810 Figure 1. The twositesarelocated 20 km fromeachother Figure 1. Transparentautomaticchamber at Kalevansuobogforest with the lid (60 x 60 x 30 cm) open. • Conclusions • The drainedbog is accumulating C in trees and peat, while the fen has a neutral C balance, i.e., the same amount of C is annually sequestered into tree stand that is lost from the peat (270 g C m-2). • This is due to higher GPP by the forestfloorvegetation and lowerpeatrespiration at the bogsite • Dry summer conditionsreduced CO2sink in bog, butincreased the sink of fen • Tree C fixation at the bog is 60% of that at the fenbut the forestfloor GPP is 800% of that at the fen, which is related to the sparsercanopy at the bogsite • CH4 and N2O fluxes at bothsiteswerenegligibleifcompared to CO2 • The nutrient status of forestry-drainedpeatlands is likely to determine the fate of peatcarbon, with highpeatlossrates in fentypepeatlands, whilebogsmayinsteadremain C sinks Table 1. Treecarbonstore and fixationrate and peatproperties at the twosites. Jun-Aug/annual mean T precip.sum (degC) (mm) 2010 17.0/3.6 300/730 2011 16.9/5.9 160/660 2012 14.3/4.2 210/730 Figure 2. Cumulative daily NEE at a) Kalevansuo in 2005-2008 and b) Lettosuo in 2010-2012. Negative (positive) valueindicatenet CO2uptake (emission) by the ecosystem. Numberpanelswithin the figure show the meanweatherconditionsduring the measurementyears.