Download
1 / 22
220 likes | 328 Views
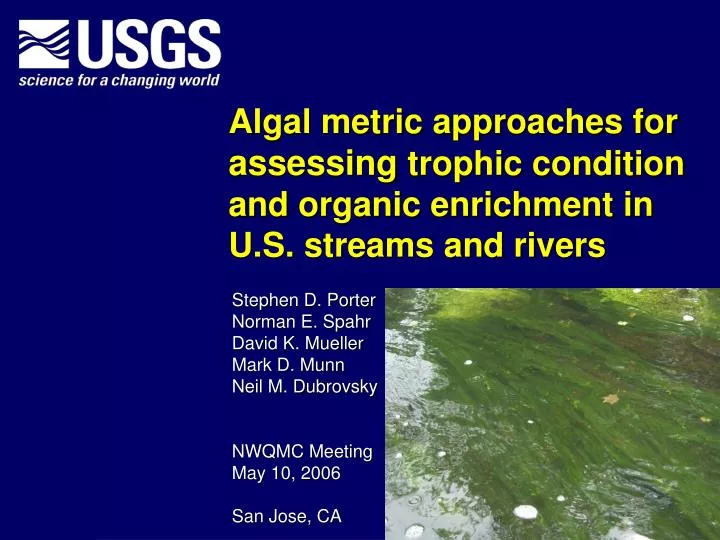
Algal metric approaches for assessing trophic condition and organic enrichment in U.S. streams and rivers. Stephen D. Porter Norman E. Spahr David K. Mueller Mark D. Munn Neil M. Dubrovsky NWQMC Meeting May 10, 2006 San Jose, CA. Why are algae important for assessing water quality?.

E N D
Algal metric approaches for assessing trophic condition and organic enrichment in U.S. streams and rivers Stephen D. Porter Norman E. Spahr David K. Mueller Mark D. Munn Neil M. Dubrovsky NWQMC Meeting May 10, 2006 San Jose, CA
Why are algae important for assessing water quality? • EPA National Water Quality Inventory(305b Report to Congress) • Causes of water-quality impairment • Siltation • Nutrients • Oxygen-depleting substances • Sources of water-quality impairment • Nonpoint-source runoff from urban & agricultural land • EPA Nutrient Criteria – Streams and Rivers (U.S. EPA, 2000) • Primary Variables • Nutrients (TN & TP) • Algal Biomass (chlorophyll a) • Water Clarity (turbidity, transparency, total suspended solids) • Secondary Response Variables • Stream Metabolism—DO, pH • Biological Attributes (autecology, nature of response, grazers, IBIs)
Objectives and Scope • Which algal metrics are most useful for assessing nutrient and organic enrichment in streams and rivers? • How well do these metrics correlate with nutrient concentrations Nationally? Regionally? • Do the algal metrics discriminate among land-use categories? • How do algal metric scores respond along nutrient and land-use gradients? • Does algal biovolume (biomass, chlorophyll) vary significantly with nutrient concentrations, land-use conditions, or among major water-resource regions? Do algal metrics and nutrient concentrations provide complementary information about the effects of land-use practices on water quality? How do trophic boundaries derived from USGS biovolume data compare with proposed nutrient criteria?
Autecology…physiological requirements or tolerance range of species • Nutrients • Nitrogen: N-fixing algae, N-heterotrophs • N & P: eutrophic diatoms and soft (non-diatom) algae • Organic Enrichment • Pollution Tolerance (saprobien system; nutrients+carbon) • Dissolved oxygen requirements; tolerance to low DO • Major Ions • Salinity (specific conductance); alkalinity (hardness); certain metals • Physical Properties (pH, temperature, velocity, light, etc.) Algal Metrics...aggregation of species with similar autecological properties • Indicators of algal biomass • Chlorophyll a, Ash-free Dry Mass, Biovolume • Indicators of water quality and trophic condition • Qualitative – published literature accounts (~ 100 y history)
1.0 1.0 PT_VT ON_NH NF_YS OT_LW SP_AP PC_MT PC_MT 0.5 0.5 SP_PS SL_HB OT_VL SP_AM PT_TB ON_NH ES_SF EUTROPHIC 0.0 PCA (2) 0.0 NF_YS TR_O TR_E OT_MD SL_FR PC_LT SP_OL TR_E OT_FH SL_FB TR_M ON_AL ON_AH SL_HB -0.5 -0.5 PT_LB SP_BM OT_AH PC_SN PT_LA OT_AH -1.0 -1.0 -1.0 -0.5 0.0 0.5 1.0 -1.0 -0.5 0.0 0.5 1.0 PCA (1) PCA (1) Which algal metrics are most useful for assessment? PC_MTTolerant Diatoms—Indicator of nutrient & organic enrichment ON_NHNitrogen Heterotrophs—Indicator of organic nitrogen enrichmentTR_EEutrophic Diatoms—Indicator of nutrient enrichment SL_HBHalobiontic Diatoms—Indicator of dissolved constituents NF_YSNitrogen Fixers—Indicator of low nitrogen or N:P ratios OT_AHHigh DO Indicators—Indicator of high dissolved oxygen concentrations
Geographic regions based on aggregations of Water-Resource Regions
TN TP TN TP 912 923 912 923 180 182 180 182 121 120 121 120 248 249 248 249 60 70 60 70 81 80 81 80 79 79 79 79 103 103 103 103 40 40 40 40 1.0 1.0 TN TP 912 923 180 182 121 120 248 249 60 70 81 80 79 79 103 103 40 40 Nitrogen Heterotrophs Tolerant Diatoms 0.8 0.8 0.6 0.6 Spearman Correlation Coefficient 0.4 0.4 0.2 0.2 1 2 3 4 5 6 7 8 0.0 1 2 3 4 5 6 7 8 Nat Nat 1 2 3 4 5 6 7 8 1.0 1.0 248 249 TN TP 912 923 180 182 121 120 60 70 81 80 79 79 103 103 40 40 Halobiontic Diatoms EutrophicDiatoms 0.8 0.8 0.6 0.6 Spearman Correlation Coefficient 0.4 0.4 0.2 0.2 0.0 0.0 Nat Nat 1 2 3 4 5 6 7 8 Region How well do “tolerant” algal metrics correlate with nutrients? Total Nitrogen Total Phosphorus
How well do “sensitive” algal metrics correlate with nutrients? 0.5 0.5 TN TP 912 923 180182 121 120 248 249 60 70 81 80 79 79 103 103 40 40 TN TP 912 923 180 182 121 120 248 249 81 80 103 103 40 40 60 70 79 79 High DO Indicators Nitrogen Fixers 0.3 0.3 Total Nitrogen Total Phosphorus 0.1 0.1 Spearman Correlation Coefficient -0.1 -0.1 -0.3 -0.3 -0.5 -0.5 Nat 1 2 3 4 5 6 7 8 1 2 3 4 5 6 7 8 Nat Region Region 0.5 0.5 Nitrogen Fixers High DO Indicators 0.3 0.3 Nitrate Orthophosphate 0.1 0.1 Spearman Correlation Coefficient -0.1 -0.1 -0.3 -0.3 -0.5 -0.5 1 2 3 4 5 6 7 8 Nat Nat 1 2 3 4 5 6 7 8 Region Region
100 a a a c b a 80 100 bc a c ab ab d 60 Nitrogen Heterotrophs Tolerant Diatoms ON_NH (relative abundance) 80 40 60 PC_MT (relative abundance) 20 40 0 Ag Mixed Large Urban Partial Undev 20 Land Cover 0 Ag Mixed Large Undev Urban Partial Land Cover 100 100 c d ab bc a a ab a c b a a Halobiontic Diatoms Eutrophic Diatoms 80 80 60 60 TR_E (relative abundance) SL_HB (relative abundance) 40 40 20 20 0 0 Ag Urban Undev Mixed Large Ag Partial Large Undev Partial Urban Mixed Land Cover Land Cover What do algal metrics tell us about land use?
20 3 a c b a a a ab ab d c a bc Total Nitrogen Total Phosphorus 15 2 Total Nitrogen (mg/L) Total Phosphorus (mg/L) 10 1 5 0 0 Ag Ag Urban Mixed Partial Undev Large Urban Large Undev Mixed Partial Land Cover Land Cover 15 b a a b c a 2.0 ab c ab a bc d Nitrite + Nitrate Orthophosphate 10 1.5 Nitrite + Nitrate Nitrogen (mg/L) Orthophosphate (mg/L) 1.0 5 0.5 0 Ag Undev Urban Partial Large Mixed 0.0 Ag Land Cover Undev Large Mixed Urban Partial Land Cover What do nutrient concentrations tell us about land use?
How well do algal metrics & nutrients discriminate between undeveloped and developed stream basins? Neither Algae nor Nutrients Algae = Nutrients Nutrients better than Algae Nutrients better than Algae
How do algal-metric scores respond along nutrient gradients? 100 100 RMSE = 18.7 (94%) n = 912 RMSE = 19.0 (96%) n = 922 80 80 60 60 Percentage of eutrophic diatoms Percentage of eutrophic diatoms 40 40 20 20 0 0 Percentage of eutrophic diatoms 0 3 6 9 12 15 0 1 2 3 4 5 Total Nitrogen (mg/L) Total Phosphorus (mg/L) 100 100 RMSE = 19.1 (97%) n = 973 RMSE = 19.2 (98%) n = 973 80 80 60 60 Percentage of eutrophic diatoms Percentage of eutrophic diatoms 40 40 20 20 0 0 0 3 6 9 12 15 0 1 2 3 4 5 Orthophosphate (mg/L) Nitrite + Nitrate Nitrogen (mg/L)
100 100 80 80 60 60 Percentage of eutrophic diatoms Percentage of eutrophic diatoms 40 40 20 20 0 0 0 20 40 60 80 100 0 20 40 60 80 100 Percentage of urban land (ag < 25%) Percentage agricultural land (urban < 5%) How do algal-metric scores respond along land-use gradients? RMSE = 16.7 (100%) n = 634 RMSE = 18.7 (118%) n = 505
1000 100 10 Biovolume (cm3/m2) 1 0.1 0.01 0.001 0.0001 1 2 3 4 5 6 7 8 Ag Large Mixed Urban Partial Undev Region Land Use Algal biovolume relations with geographic region, water quality, and land use Median • National: (positive relation) Nitrate (r = 0.179, p<0.001) • (negative relation) Suspended Sediment (r = -0.168, p=0.001) • Regions 4, 7, & 8:(positive relation) TN, Nitrate, TP (r > 0.3) • Region 5:(negative relation) Suspended Sediment, TP (r < -0.4)
1000 100 Eutrophic Mesotrophic Oligotrophic 10 Biovolume (cm3/m2) 1 0.1 0.01 0.001 0.0001 1 2 3 4 5 6 7 8 Ag Large Mixed Urban Partial Undev Region Land Use Dodds et al. (1998) benthic CHLa (mg/m2) Biovolume (cm3/m2) est. CHLa (mg/m2) Oligotrophic-Mesotrophic1.35 21 20 Mesotrophic-Eutrophic15 66 70 Estimating trophic boundary conditions
Distribution of algal biovolume < 1.35 1.35 – 5.67 5.68 – 15 > 15.01 , cm3/m2
Distribution of eutrophic diatoms Eutrophic Diatoms, percent
Distribution of nitrogen-fixing algae Nitrogen Fixers, percent
Summary & Conclusions 1. What do algal metrics tell us about water quality? Strong correlation with nutrient concentrationsDiscrimination between developed & undeveloped basinsResponses along nutrient and land-use gradients Distribution of algal tolerance indicators corresponds with major agricultural and urban areas. 2. What does algal biovolume tell us about water quality? Weak correlation with nutrient and sediment concentrationsNo significant differences among land-use or regional categories Algal biomass may be controlled more by antecedent hydrologic disturbance, shading, or biological interactions (e.g. grazers) than land-use practices or nutrient concentrations. Local scale response.
Summary & Conclusions 3. How can algal indicators of stream condition be applied to nutrient and biological criteria? Autecological metrics reflect responses to eutrophication processesBiovolume (standing crop)—hydrology relations (days of accrual)Indicators of organic enrichment Algal data available from NAWQA Data WarehouseTaxonomic consistency: ANSP http://diatom.acnatsci.org/nawqa/ Autecology: NAWQA Algal Attributes table Data Analysis: Algal Data Analysis System (ADAS—T.F. Cuffney) PhycoAide (ANSP)
Stephen D. Porter USGS—Water Resources NAWQA National Synthesis Box 25046, MS406, DFC Denver, CO 80225 sdporter@usgs.gov 303-445-4647 Literature Cited Dodds, W.K., Jones, J.R., and Welch, E.B., 1998, Suggested classification of stream trophic state: Distributions of temperate stream types by chlorophyll, total nitrogen, and phosphorus. Water Resources, v. 32, no. 5, p. 1455-1462.U.S. Environmental Protection Agency, 2000, Nutrient criteria technical guidance manual. Rivers and Streams. Washington, D.C.: U.S. Environmental Protection Agency, Office of Water, EPA-822-B-00-002, 240 p.