Download
1 / 31
500 likes | 1.78k Views
Chapter 19 Nuclear Magnetic Resonance Spectroscopy. Nuclear magnetic resonance (NMR) spectroscopy is based on the measurement of absorption of electromagnetic radiation in the radio-frequency region of roughly 4 to 900 MHz.

E N D
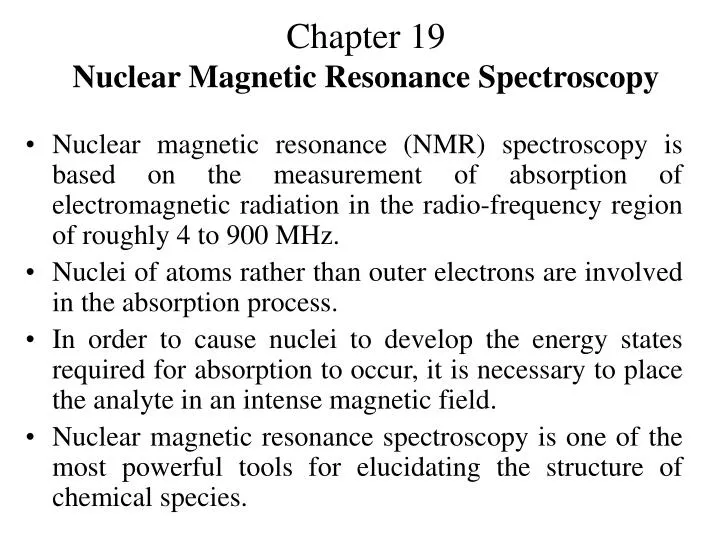
Chapter 19Nuclear Magnetic Resonance Spectroscopy • Nuclear magnetic resonance (NMR) spectroscopy is based on the measurement of absorption of electromagnetic radiation in the radio-frequency region of roughly 4 to 900 MHz. • Nuclei of atoms rather than outer electrons are involved in the absorption process. • In order to cause nuclei to develop the energy states required for absorption to occur, it is necessary to place the analyte in an intense magnetic field. • Nuclear magnetic resonance spectroscopy is one of the most powerful tools for elucidating the structure of chemical species.
Quantum Description of NMR The maximum number of spin components or values for a particular nucleus is its spin quantum number I. The nucleus will then have 2I + 1 discrete states. The four nuclei that have been of greatest use are 1H, 13C, 19F, and 31P. The spin quantum number for these nuclei is ½. Thus, each nucleus has two spin states corresponding to I = + ½ and I = - ½. A spinning, charged nucleus creates a magnetic field.
Quantum Description of NMR The resulting magnetic moment is oriented along the axis of spin and is proportional to the angular momentum P. Thus, = p where the proportionality constant is the magnetogyric ratio, which has a different value for each type of nucleus. • Energy Levels in a Magnetic Field: When a nucleus with a spin quantum number of one half is brought into an external magnetic field B0, its magnetic moment becomes oriented in one of two directions with respect to the field depending upon its magnetic quantum state.
Types of NMR Spectra There are several types of NMR spectra, which depend upon the kind of instrument used, the type of nucleus involved, the physical state of the sample, the environment of the analyte nucleus, and the purpose of the data collection. Most NMR spectra can be categorized as either wide line or high resolution. • Wide-Line spectra: Wide-line spectra are those in which the bandwidth of the source of the lines is large enough so that the fine structure due to chemical environment is obscured. A single peak is associated with each species.
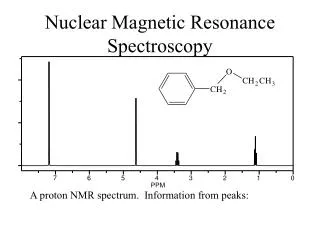
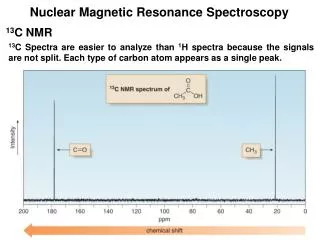
Types of NMR Spectra • High-Resolution Spectra: Most NMR spectra are high resolution and are collected by instruments capable of differentiating between very small frequency differences of 0.01 ppm or less. In the lower-resolution spectrum for the protons in ethanol, three peaks are observed arising from absorption by the CH3, CH2, and OH protons. But in the higher resolution spectrum, two of the three peaks can be resolved into additional peaks.
ENVIRONMENTAL EFFECTS ON NMR SPECTRA The frequency of RF radiation that is absorbed by a given nucleus is strongly affected by its chemical environment – that is, by nearby electrons and nuclei. As a consequence, even simple molecules provide a wealth of spectral information that can serve to elucidate their chemical structure. The discussion that follows emphasizes proton spectra because 1H is the isotope that has been studied most widely.
Types of Environmental Effects Chemical shift and spin-spin splitting: Both the chemical shift and spin-spin splitting are important in structural analysis. Experimentally, the two are easily distinguished, because the peak separations resulting from a chemical shift are directly proportional to the field strength or to the oscillator frequency. • Origin of the Chemical Shift: The chemical shift is caused by small magnetic fields that are generated by electrons as they circulate around nuclei. These fields usually oppose the applied field. As a consequence, the nuclei are exposed to an effective field that is usually somewhat smaller than the external field.
Types of Environmental Effects Origin of Spin-Spin Splitting: The splitting of chemical shift peaks occurs as the magnetic moment of a nucleus interacts with the magnetic moments of immediately adjacent nuclei. The magnetic field created by a spinning nucleus affects the distribution of electrons in its bonds to other nuclei. This change in electron distribution then produces changes in the magnetic field of adjacent nuclei and causes splitting of energy levels and hence multiple transitions.
Abscissa Scales for NMR Spectra The determination of the absolute magnetic field strength with the accuracy required for high-resolution NMR measurements is difficult or impossible. On the other hand, it is entirely feasible to determine the magnitude of a change in field strength. It is expedient to report the position of resonance absorption peaks relative to the resonance peak for an internal standard substance that can be measured during the experiment. The use of an internal standard is also advantageous in that chemical shifts can be reported in terms that are independent of the oscillator frequency.
Abscissa Scales for NMR Spectra The compound most generally used for proton studies is tetramethylsilance (TMS), (CH3)4Si. All of the protons in this compound are identical. Thus, the compound provides a single sharp peak at a high applied field that is nearly always isolated from the peaks of interest in a spectrum. In addition, TMS is inert, readily soluble in most organic liquids, and easily removed from samples by distillation (b.p. = 27oC). TMS is not water soluble; in aqueous media, the sodium salt of 2,2-dimethyl-2silapentane-5sulfonic acid (DSS), (CH3)3SiCH2CH2CH2SO3Na, is normally used in its place. The methyl protons of this compound produce a peak at virtually the same place in the spectrum as that of TMS.
Abscissa Scales for NMR Spectra The methylene protons of DSS give a series of small peaks that may interfere. For this reason, most DSS now on the market has the methylene groups deuterated, which eliminates these undesirable peaks. The quantity is dimensionless and expresses the relative shift in parts per million. Most proton peaks lie in the range of 1 to 13. For other nuclei, the range of chemical shifts is greater because of the associated 2p electrons. 13C 0 to 220 ppm, 19F as large as 800 ppm, 31P 300 ppm or more. NMR plots have scales that are linear in , and historically the data were plotted with the field increasing from left to right. The zero value for the scale corresponds to the TMS peak, and the value of increases from right to left.
Theory of the Chemical Shift Correlation of Chemical Shift with Structure: The chemical shift is used to identify functional groups and to aid in determining structural arrangements of groups. These applications are based upon empirical correlations between structure and shift. A number of correlations charts and tables have been published, two of which are shown in Fig. 19-17 and Table 19-2. Keep in mind that the exact values for may depend upon the nature of the solvent as well as upon the concentration of solute.
Rules Governing the Interpretation The following rules govern the appearance of spectra. 1. Equivalent nuclei do not interact with one another to give multiple absorption peaks. 2. Coupling constants decrease significantly with separation of groups, and coupling is seldom observed at distances greater than four bond lengths. 3. The multiplicity of a band is determined by the number n of magnetically equivalent protons on the neighboring atoms and is given by the quantity n + 1.
Rules Governing the Interpretation 4. If the protons on atom B are affected by protons on atoms A an C that are nonequivalent, the multiplicity of B is equal to (nA + 1)(nC + 1), where nA and nC are the number of equivalent protons on A and C, respectively. 5. The approximate relative areas of a multiplet are symmetric around the midpoint of the band. 6. The coupling constant is independent of the applied field.
Example 19-5 Figure 19-25
Example 19-6 Figure 19-26
Problem 19-31. Compound containing single bromine Figure 19-39
Problem 19-32. Empirical Formula C4H7BrO2 Figure 19-40
Problem 19-33. Empirical Formula C4H8O Figure 19-41
Problem 19-34. Empirical Formula C4H8O2 Figure 19-42
Problem 19-35. Empirical Formula C8H10 Figure 19-43a
Problem 19-35. Empirical Formula C8H10 Figure 19-43b