Download
1 / 23
230 likes | 495 Views
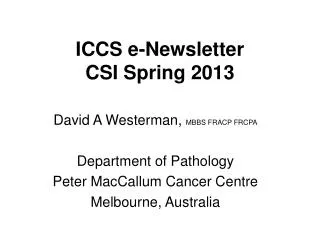
ICCS e -Newsletter CSI Winter 2013. Jacqueline Emmons, MD Department of Pathology University of Texas Southwestern Medical Center Dallas, Texas. History. 11 month old female with a history of fever and failure to thrive On physical exam, the child was pale and lethargic. CBC Data.

E N D
ICCS e-Newsletter CSIWinter 2013 Jacqueline Emmons, MD Department of Pathology University of Texas Southwestern Medical Center Dallas, Texas
History • 11 month old female with a history of fever and failure to thrive • On physical exam, the child was pale and lethargic.
CBC Data A manual differential of the peripheral blood revealed 69% blasts.
A peripheral blood sample was received in the flow cytometry lab with the indication to “rule out acute leukemia.” • Selected tubes from the diagnostic analysis are included in this case study for review.
A four color analysis was performed using a BD FACScalibur™ flow cytometer. An ungated, cluster analysis was performed with BD Paint-a-Gate™ software. Files are in FCS2.0 format. • Tubes with the following antibody combinations are included for review.
TUBE 1 Upon opening the file, it is apparent that there are a large number of CD34(+) events. After using CD34 to isolate the cells of interest (painted in red), the forward versus side scatter plot can be used to further define or “clean up” the population. Here, all events outside of the “blast gate” are highlighted in black and will be excluded. granulocytes debris doublets
TUBE 1 The CD34(+) blasts (red) are negative for CD20 and CD10 and are partial dim positive for CD22.
TUBE 2 As anti-CD34 is included in tube 2 as well, the blasts can be isolated and analyzed in a similar fashion to tube 1. In addition, other cell types can also be studied in this tube. To look for any CD34(-) monocytic cells, CD14 can be used to gate. The population can then be better defined using the forward versus side scatter and CD34. Exclusion of debris, lymphocytes, granulocytes, and doublets Exclusion of CD34(+)events
TUBE 2 Granulocytes painted green on forward versus side scatter eosinophils Neutrophilic elements Clean up with CD34(+)
TUBE 2 Small lymphocytes can be isolated by first painting on the forward versus side scatter. Some of the blasts are small and overlap with the lymphocyte gate in this plot. The CD34 can be used to exclude blasts. Then, CD14 can be used to exclude monocytes.
TUBE 2 A complete analysis of tube 2 with all cell populations analyzed would look like this: Color Key: Red: Blasts Light blue: Lymphocytes Dark blue: Monocytes Green: Granulocytes
TUBE 2 The blasts are CD19(partial +) and CD11b(partial +). A few of the blasts appear to express CD14.
Tubes 3 – 7 can all be analyzed in a similar manner to tubes 1 and 2. • The immunophenotype of the blasts is as follows: • CD34(+) • CD2(-) • CD10(-) • CD11b(partial +) • CD11c(partial +) • CD14(few cells +) • CD15(partial +) • CD19(partial +) • CD20(-) • CD22(partial dim +) • CD33(variably +) • CD34(+) • CD45(moderately +) • CD64(partial +) • Cytoplasmic CD79a(partial +) • CD117(few cells +) • Cytoplasmic MPO(-)
The blasts express markers of both myeloid and B-lymphoid differentiation. • In addition to nonspecific myeloid markers such as CD15 and CD33, the blasts express markers suggesting monocytic differentiation (CD11c, dual expression of CD64 and CD36, a few cells positive for CD14) • B-lymphoid markers include partial strong expression of CD19, partial expression of CD22, and partial expression of CD79a
Blasts in the peripheral blood smear. An NSE cytochemical stain supports monocytic differentiation (inset)
Evidence of MLL gene rearrangement by FISH Split MLL gene Intact MLL gene
Diagnosis: Mixed phenotype acute leukemia, B/myeloid with MLL gene rearranged
Mixed phenotype acute leukemia (MPAL) • MPALs express markers of one or more lineages to a significant degree • MPALs may be: • Bilineal: two separate blast populations each of a different lineage • Biphenotypic: one blast population expressing markers of two different lineages • Rare cases showing trilineage differentiation have been described • Specific cytogenetic abnormalities may be associated with MPAL • t(9;22)(q34;q11.2);BCR-ABL1 • t(v;11q23);MLL rearranged • Flow cytometry is integral in the diagnosis of MPAL
MPAL with MLL gene rearranged • The case presented is characteristic for an MPAL with MLL gene rearrangement • MPAL with MLL rearranged is more common in the pediatric population, particularly in infants • Patients typically present with a high white blood cell count • The leukemia usually demonstrates evidence of both monocytic and B-lymphoid differentiation • Commonly, the leukemic blasts show two different populations morphologically – a population of monoblasts and a population of lymphoblasts • Some cases may present with one population of blasts with no clear distinguishing features by morphology • CD10 is usually negative • CD22 and CD79a are often weak • This type of acute leukemia is associated with a poor prognosis.
Mixed Lineage Leukemia gene (MLL) on chromosome 11q23 • MLL is not only implicated in MPAL in infants • Rearrangements of the MLL gene occur in acute leukemias in patients of all ages and often in therapy-related hematopoietic neoplasms after treatment with topoisomerase II inhibitors • MLL rearrangements can be seen in ALL, AML, and MPAL • Account for >70% of infant leukemias • Large and diverse group of translocation partners • Over 50 translocation partners have been characterized
Mixed Lineage Leukemia gene (MLL) on chromosome 11q23 • AML with MLL rearrangement usually shows evidence of monocytic differentiation • BLL with MLL rearrangement tends to occur in infants presenting with a high white blood cell count and CNS involvement. The leukemic cells are characteristically CD10(-).
References SwerdlowSH, Campo E, Harris NL, et al., editors. WHO Classification of Tumours of Haematopoietic and Lymphoid Tissues. Lyon, France: IARC; 2008. Muntean AG, Hess JL. The pathogenesis of mixed-lineage leukemia. Annu Rev Pathol. 2012;7:283-301. MatutesE., Pickl WF, et al. Mixed-phenotype acute leukemia: clinical and laboratory features and outcome in 100 patients defined according to the WHO 2008 classification. Blood.2011 Mar 17;117(11):3163-71. Sam TN, Kersey JH, Linabery AM, et al. MLL gene rearrangements in infant leukemia vary with age at diagnosis and selected demographic factors: a Children's Oncology Group (COG) study. Pediatr Blood Cancer. 2012 Jun;58(6):836-9