Download
1 / 10
100 likes | 178 Views
measuring living standards from budget surveys. Andrew Newell, University of Sussex TNA-Sussex Teacher-Scholar Scheme Autumn 2012. TNA-Sussex Teacher-Scholar Scheme Autumn 2012. What produces a particular standard of living?

E N D
measuring living standards from budget surveys Andrew Newell, University of Sussex TNA-Sussex Teacher-Scholar Scheme Autumn 2012
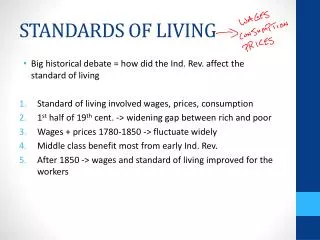
TNA-Sussex Teacher-Scholar Scheme Autumn 2012 • What produces a particular standard of living? • Suggest: include everything that contributes to the well-being (physical, intellectual, emotional) of a household • I nominate four groups of inputs: • (1) the skills and energy of those who work towards providing for that well-being • (2) the time they use in that provision • (3) the resources employed, both the non-durable goods and services (e.g. food, fuel, medicines, visits to the dentist, bus journeys) and the durable goods (e.g. dwellings and transport equipment) • (4) external/environmental resources (everything else) • We will see that (1) skills and energy and (4) external resources are almost never measured, to my knowledge, in standard budget surveys. Time spent working (2) around the home is very rarely measured, though there are some Time Use surveys....
TNA-Sussex Teacher-Scholar Scheme Autumn 2012 • What we use, in the main, are household budget surveys. These are surveys that collect data on income, expenditures and other household characteristics over a period of time, from a large number of households, using a common questionnaire. • A little history: The collection of budget data from working class households was increasingly practised through the 19th century. Here is a really interesting paper that reviews progress in the field at the end of that century: Henry Higgs, Workmen's Budgets, Journal of the Royal Statistical Society, Vol. 56, No. 2 (Jun., 1893), pp. 255-294. • In the paper, Higgs contrasts the extensive method of enquiry, by which he means household budget surveys, with necessarily limited questionnaires, with the intensive study methods of the French pioneer le Play. • Wiki linkPierre Guillaume Frédéric le Play
TNA-Sussex Teacher-Scholar Scheme Autumn 2012 • le Play would take a typical family and then ‘live in it or near it for some weeks, closely examining its receipts and expenses, its capital and mode of life, and describing it with the same care and interest which scientists have lavished upon ants and plants’ (Higgs, p262). • One of the points Higgs emphasises how the intensive method of le Play can be used to illustrate the importance of skill and effort, or in his terms, ‘good housewifery’ (p269), in contrast to standard survey methods, which have never tried to capture this. • Large-scale surveys have many uses, though, and one of the uses to which budget surveys have been put ever since, is to create weights for a cost-of-living price index. Indeed this was one of the main purposes of our 1904 and 1937-8 surveys (more on this below)
TNA-Sussex Teacher-Scholar Scheme Autumn 2012 • Budget surveys can give us an impression of the distribution across households of measures, such as income or total expenditure that are strongly, but not perfectly correlated with most other possible measures of living standards. However, the collection of reliable data on income or expenditure is not straightforward. • Issue 1, should we use estimates of income (potential resources), expenditure or consumption? • Income. The amount of money received during a period of time in exchange for labour or services, from the sale of goods or property, or as a profit from financial investments. • Expenditure. Money or credit payments to obtain goods or services. • Consumption. Final use of goods and services, excluding the intermediate use of some goods and services in the production of others. Includes a valuation for capital services, e.g. Imputed rent for owner-occupied dwellings. • So consumption is nearest to (3), but estimation of the ‘rental value’ of capital goods induces estimation errors.
TNA-Sussex Teacher-Scholar Scheme Autumn 2012 • The choice boils down to ease and accuracy of data collection. Income and expenditure data are both difficult to collect comprehensively and accurately. • In economically developed countries, in which a large proportion of the population works in the formal sector and in which expenditure patterns are very complex, the balance often tips in favour of measuring income rather than consumption. • Even so, these surveys often have considerable problems dealing with self-employment, informal economic activities, and a perhaps understandable reluctance to disclose information on income to survey enumerators. It is also important that the question is asked the right way, distinguishing , for instance regular income from actual income, which might differ due to overtime payments, sickness etc. • In developing countries, formal employment is less common, many households have multiple and continually changing sources of income, and home production is more widespread. In these contexts, it is generally more reliable to data on consumption than income or expenditures, which would exclude the value of home production and may include spending generated by entrepreneurial activity.
TNA-Sussex Teacher-Scholar Scheme Autumn 2012 • Lastly, attempts to gather data on quantities of goods purchased, rather than expenditures, have largely been abandoned. The 1904 and 1953-4 surveys did ask for quantities, but, especially by 1953-4, the massive variety of measures: ‘a tin’ ‘a bottle’ ‘a packet’ etc, renders these measures very hard to standardise for comparison. • Proxy measures. Given the difficulties of collecting income, expenditures and quantities, some investigators have sought to estimate standards of living from some easily detectable household characteristics. For instance, I’ve seen surveys of rural villages in developing countries where the standard of living measure is derived from answers to questions such as ‘do the family have a radio?’ How many bicycles does the family own?’ ‘Is the roof of the house made of metal?’ The answers can be combined to give the household a standard of living score.
TNA-Sussex Teacher-Scholar Scheme Autumn 2012 • Adjusting for family size. The simplest was to make an adjustment is to divide by the number of people in the household, creating, for instance, a measure of income per capita. • The obvious objection to a per capita measure is that children in particular and perhaps adults by age, gender and activity level, have different needs, especially for food. Also some household goods and services are ‘non-rival’. (heating is an example: with an open fire, me being warm does not stop you getting warm), so large families benefit from such economies of scale. • The alternative to a per capita measure, that can get around the first objection, but not necessarily the second is to use an adult equivalence scale. These have a long history. Many early researchers realised that costs differ between children and adults. Bowley’s 1912-13 study of Northern Towns assumed a child aged under 6 costs 44% of an adult; children aged 6-13 cost 60% of an adult and those aged 14-16 cost 91% of an adult. • The modern approach is to estimate an equivalence scale from the survey data. I can dig deeper into this if it is of interest. The World Bank Living Standards Measurement Study website has a mass of great resources on these topics
TNA-Sussex Teacher-Scholar Scheme Autumn 2012 • A histogram of per equivalent adult income in the 1904 survey showing the proportion of families with incomes below Bowley’s poverty line of (roughly 5 shillings per equivalent adult)