Download
1 / 27
280 likes | 357 Views
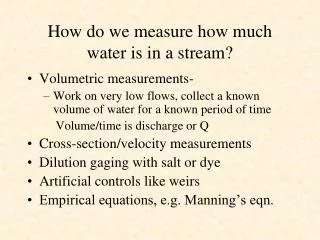
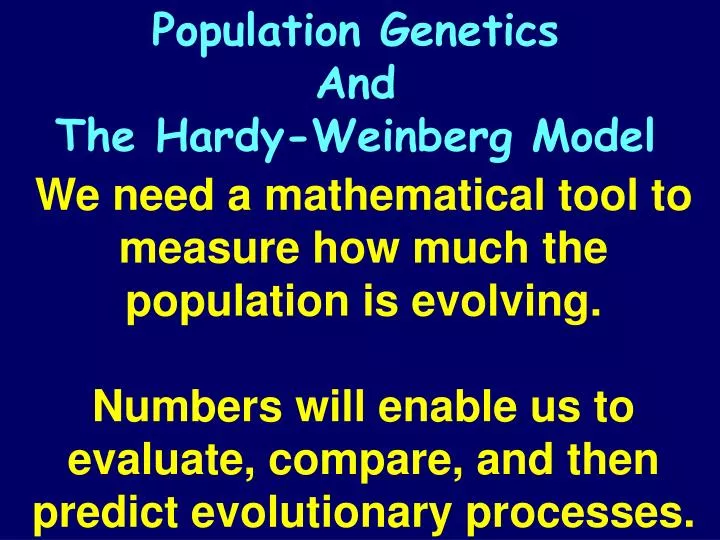
Population Genetics And The Hardy-Weinberg Model. We need a mathematical tool to measure how much the population is evolving. Numbers will enable us to evaluate, compare, and then predict evolutionary processes.

E N D
Population Genetics And The Hardy-Weinberg Model We need a mathematical tool to measure how much the population is evolving. Numbers will enable us to evaluate, compare, and then predict evolutionary processes.
Suppose we could quantify, give numbers, how fast a population is evolving in terms on one single trait. How would this be useful for medicine, studying the wildlife, other?
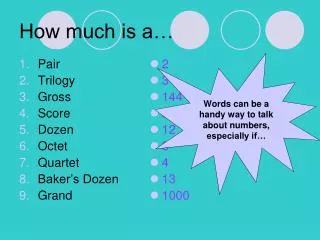
Let’s Define: a Populationis a localized group of interbreeding individuals. Gene poolis the entire collection of alleles in the population. (What is the size of our class’ gene pool?) Allele frequencyis how common (in %) an allele (H or h) is in the population.(What are the frequencies in our cards?)
Evolution = a change in the allele frequencies. How can we tell if the allele frequencies are changing from a single observation? We predict how a gene pool should be like if there is no change. Then we compare to the actual gene pool.
G.H. Hardy Mathema-tician W. Weinberg physician Hardy and Weinberg: “At equilibrium (not evolving) the frequencies of the alleles do not change”. Mix alleles, try again: What are the frequencies of H, h in our class?
5 Agents of evolutionary change Non-random mating Mutation Gene Flow Selection Genetic Drift
Hypothetical conditions under which the allele frequencies do not change: • 1. very large population size • 2. no migration (no gene flow in or out) • 3. no mutation (no genetic change) • 4. random mating (no sexual selection) • 5. no natural selection (everyone is equally fit)
Under the Hardy-Weinberg conditions: We assume 2 alleles = H, h frequency of dominant allele (H) = p frequency of recessive allele (h) = q 1) Frequencies must add up to 1 (100%), so: p + q = 1 HH Hh hh
Accordingly – what are the chances to select a certain genotype? Phenotype? H (p) h (q) HH Hh H (p) p2 qxp Hh hh h (q) q2 pxq q2
Hardy-Weinberg theorem Counting Individuals: frequency of HH: pxp = p2 frequency of hh:qxq = q2 frequency of Hh: (pxq) + (qxp) = 2pq 2) Frequencies of all individuals must add to 1 (100%), so: p2 + 2pq + q2 = 1
Using Hardy-Weinberg equation population: 100 cats 84 black, 16 white How many of each genotype? q2 (bb): 16/100 = .16 q (b): √.16 = 0.4 p (B): 1 - 0.4 = 0.6 p2=.36 2pq=.48 q2=.16 BB Bb bb What are the genotype frequencies? Must assume population is in H-W equilibrium!
Using Hardy-Weinberg equation BB Bb bb p2=.36 2pq=.48 q2=.16 Assuming H-W equilibrium BB Bb bb Null hypothesis p2=.20 p2=.74 2pq=.64 2pq=.10 q2=.16 q2=.16 Actual data How do you explain the data? How do you explain the data?
In this population, we find that the frequency of heterozygotes is greater than expected under the H-W assumption. Therefore: • The population is not at equilibrium (Why???) • There might be an advantage to being a heterozygote. Why??
Let’s try it with alleles in ‘our hands’ h = albino H = non-albino Each student gets two alleles at random. Will the allele frequencies agree with the H-W equation?
AP Biology 2008 writing question: Evolution involves change in the frequencies of alleles in a population. For a particular genetic locus in a population, the frequency of the recessive allele (a) is 0.4 and the frequency of the dominant allele (A) is 0.6. a. What is the frequency of each genotype (AA, Aa, aa) in this population? b. What is the frequency of the dominant phenotype?
To Conclude: * The H-W equation describes a rare population that is at equilibrium. * By Comparing an actual population to the H-W frequencies, we can detect an instability in allele frequency. We can then ask which of the five H-W assumptions is not met.
Hardy-Weinberg formulas Alleles: p + q = 1 Individuals: p2 + 2pq + q2 = 1 H h HH Hh hh For a population at equilibrium: HH Hh hh
In the scarlet tiger moth (Panaxiadominula), coloration had been previously shown to behave as a single-locus, two-allele system with incomplete dominance. Data for 1612 individuals are given below: White-spotted (AA) =1469 Intermediate (Aa) = 138 Little spotting (aa) =5 Calculate: (¦)A, (¦)a, (¦)AA, (¦)Aa, (¦)aa
Scarlet tiger moth (Panaxiadominula)
Application of H-W principle Sickle cell anemia inherit a mutation in gene coding for hemoglobin oxygen-carrying blood protein recessive allele = HsHs normal allele = Hb low oxygen levels causes RBC to sickle breakdown of RBC clogging small blood vessels damage to organs often lethal
Sickle cell frequency High frequency of heterozygotes 1 in 5 in Central Africans = HbHs unusual for allele with severe detrimental effects in homozygotes 1 in 100 = HsHs usually die before reproductive age Why is the Hs allele maintained at such high levels in African populations? Suggests some selective advantage of being heterozygous…
Malaria Single-celled eukaryote parasite (Plasmodium) spends part of its life cycle in red blood cells 1 2 3
Heterozygote Advantage In tropical Africa, where malaria is common: homozygous dominant (normal) die or reduced reproduction from malaria: HbHb homozygous recessive die or reduced reproduction from sickle cell anemia: HsHs heterozygote carriers are relatively free of both: HbHs survive & reproduce more, more common in population Hypothesis: In malaria-infected cells, the O2 level is lowered enough to cause sickling which kills the cell & destroys the parasite. Frequency of sickle cell allele & distribution of malaria
Hardy-Weinberg equilibrium Hypothetical, non-evolving population preserves allele frequencies Serves as a model (null hypothesis) natural populations rarely in H-W equilibrium useful model to measure if forces are acting on a population measuring evolutionary change G.H. Hardy mathematician W. Weinberg physician
We can count the phenotypes, and accordingly, calculate the frequency of the genotypes, under equilibrium conditions. Suppose we know which allele is recessive. The chances for an offspring to inherit a b are qxq = q2