Download
1 / 37
370 likes | 456 Views
Asymmetric Properties of Early Aftershocks on Faults in California. Ilya Zaliapin. Yehuda Ben-Zion. Department of Mathematics and Statistics University of Nevada, Reno zal@unr.edu http://unr.edu/~zal. Department of Earth Sciences University of South California benzion@usc.edu

E N D
Asymmetric Properties of Early Aftershocks on Faults in California Ilya Zaliapin Yehuda Ben-Zion Department of Mathematics and Statistics University of Nevada, Reno zal@unr.edu http://unr.edu/~zal Department of Earth Sciences University of South California benzion@usc.edu http://earth.usc.edu/~ybz/ SSA Annual Meeting * Friday, April 23, 2010
Outline Seismicity as a flow of clusters 1 1 2 2 Clusters vs. physical crust properties Heat flow vs. foreshock/aftershock productivity Asymmetric distribution of close aftershocks 3 3 Summary
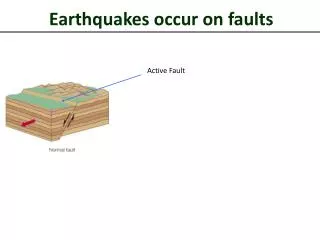
[Zaliapin et al., PRL, 101, 018501(2008)] Identification of clusters: data driven Cluster #3 Cluster #1 Cluster #2 Large distance Short distance
Identification of event types: problem driven Foreshocks Mainshock Aftershocks Time
Heat flow data [after Yang and Ben-Zion (2009), GJI, 177, 481-490.] High heat flow, intense foreshock production Low heat flow, intense aftershock production
Difference between normalized foreshock and aftershock productivity Wells, NV excess aftershock production excess foreshock production Mammoth Coso Mendocino Landers Hector Mine SAF Imperial San Simeon Ventura Salada
Asymmetry of close aftershock distribution in California Zaliapin and Ben-Zion (2010), GJI, sub judice
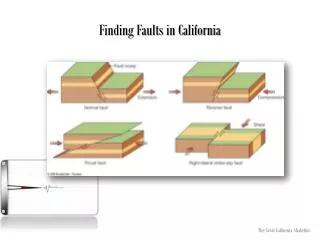
25 fault zones (circled indices) are examined Southern California Northern California After Powers and Jordan (2009), JGR, in press.
Asymmetric aftershock distribution is expected on bimaterial faults Sites of potential aftershocks slower side right-lateral strike-slip fault Propagation direction faster side May produce immediate aftershocks Included in the main rupture After Ben-Zion (2001), J. Mech. Phys. Solids, 49, 2209-2244.
Asymmetry results for 25 fault zones Strong contrast, >5% No-to-mild contrast, <5% N 90% 10% In zone 5 (the Mojave section of the SAF), the SE asymmetry is consistent with evidence (e.g., Fuiset al., 2001) for a “reversed” velocity contrast compared to the central section of the SAF (with the NE block having faster velocity) and field observations of asymmetric rock damage in that section (Doret al., 2006).
Asymmetry results for 25 fault zones Strong contrast, >5% No-to-mild contrast, <5% N 90% 10% In zone 15 (southern SAF), the NW asymmetry is consistent with velocity profile of Tape at al. (2009)
Asymmetry results for 25 fault zones Strong contrast, >5% No-to-mild contrast, <5% N 90% 10% In zone 48 (creeping section of the SAF south of Hollister) and zone 51 (creeping SAF section just north of Parkfield), the strong NW asymmetry is consistent with seismic imaging of the velocity contrast based on head waves and local tomography (e.g., McGuire and Ben-Zion, 2005; Thurber et al., 2006; Ben-Zion et al., 1992). The results in zone 48 are also consistent with similar findings of Rubin and Gillard (2000) and seismic imaging results on asymmetric rock damage (Lewis et al., 2007).
Asymmetry results for 25 fault zones Strong contrast, >5% No-to-mild contrast, <5% N 90% 10% …at the same time, in zone 52 we find no asymmetry. This is consistent with minor average contrast based on the head-wave study of Zhao et al. (2010) and local tomography (Eberhart-Phillips and Michael, 1993; Thurber et al., 2006).
Asymmetry results for 25 fault zones Strong contrast, >5% No-to-mild contrast, <5% N 90% 10% All 5 strong contrast and 18 out of 20 no-to-mild contrast zones show statistical asymmetry consistent with the observed velocity contrast
Summary Seismic flow: Flow of clusters 1 1 Earthquake productivity reflects regional properties of the crust 2 2 High heat flow – increased foreshock production Low heat flow – increased aftershock production Asymmetric aftershock distribution on bimaterial faults 3 3 Strong velocity contrast – asymmetric aftershock distribution No velocity contrast – symmetric aftershock distribution
Let r be the distance to the parent in km; and t be the time to parent in years. 1) The normalized space distance is which is the distance normalized by the parent rupture length (e.g., Ben-Zion, 2008). 2) The signed normalized distance S is 3) The asymmetry index A for a sequence with N children is 4) The asymmetry index A within a zone with M sequences is
A sequence with notable NW asymmetry in SAF, no. Parkfield. Mainshock, m = 5.03. The asymmetry index is A = +7.95.
Earthquake cluster analysis Baiesi and Paczuski, PRE, 69, 066106 (2004) Zaliapin et al., PRL, 101, 018501(2008)
Expected number of EQs with magnitude m (Fractal) dimension of epicenters Intercurrence time Spatial distance Gutenberg-Richter law Distance between EQs Magnitude m Space Time [M. Baiesi and M. Paczuski, PRE, 69, 066106 (2004)]
Spatio-temporal distribution of neighbors Homogeneous flow (no clusters) Rescaled distance, log R Rescaled time, log T
Spatio-temporal distribution of neighbors Homogeneous flow (no clusters) Rescaled distance, log R Clusters Rescaled time, log T
ANSS catalog for California (109064 events M>2.0)
Number of foreshocks, m ≥ 2 Coso Imperial Valley
Number of events, m ≥ 2 Landers Joshua tree
Number of mainshocks, m ≥ 2 SAF San Jacinto
SAF, No. Parkfield (51) SAF, Mojave (5) SAF, creeping (49) Imperial (14) Normalized distance, R Normalized time, T