Download
1 / 12
120 likes | 247 Views
The effect of light intensity to the Rate of Photosynthesis (Group 8). FAISAL, Farhan A. BUCIO, Kyna Desiree E. GARRIDO, Nurissa M. POMOY, Rica Blanche C. Objective To investigate the effect of light intensity to the rate of photosynthesis of aquatic plant.

E N D
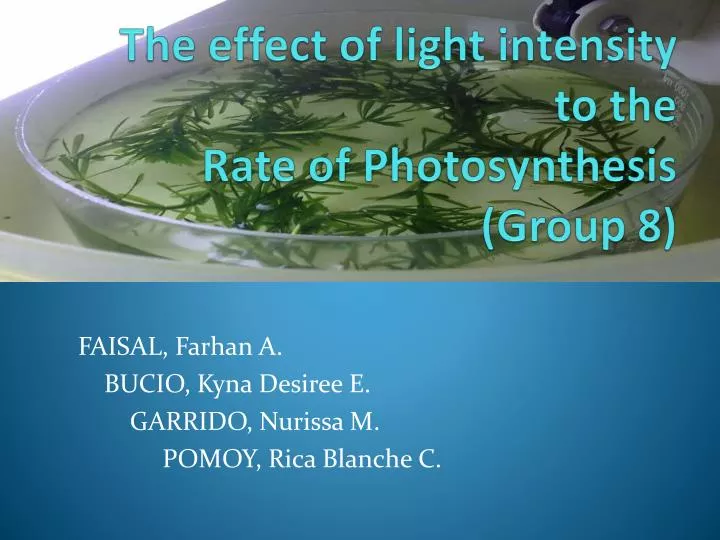
The effect of light intensity to the Rate of Photosynthesis(Group 8) FAISAL, Farhan A. BUCIO, Kyna Desiree E. GARRIDO, Nurissa M. POMOY, Rica Blanche C.
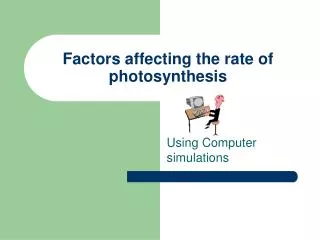
Objective • To investigate the effect of light intensity to the rate of photosynthesis of aquatic plant.
II. MATERIALS • AQUATIC PLANT • WATER • BASIN • RULER • WEIGHING SCALE • LIGHT SOURCE
PREPARATION OF SETUPS WEIGHING DISTANCE MEASUREMENT COUNTING OF BUBBLES
III. Method 1.)Materials were gathered. 2.) The aquatic plant was weighed using the weighing scale. 3.)Water was measured. 4.) 2 set-ups were prepared.
Set up A – 10 g of aquatic plant was fully submerged to a 700 ml of water. Then a light source was placed close to the container. • Set up A – 10 g of aquatic plant was fully submerged to a 700 ml of water only with room lighting.
5.) The light source on set up A was powered on. 6. ) The distance of the light source on setup A was varied 7.)The bubbles generated per minute by the plants were counted thrice with an interval of four minutes. 8.) Data were recorded.
IV. RESULTS TABLE 1. SET UP A (with light lamp) Bubbles per minute
TABLE 2. SET UP B (room lighting) Bubbles per minute
Graph 1 (comparison) Number of Bubbles Per minute distance
DISCUSSION Table 1 showed the number of bubbles produced by the aquatic plant when the distance of the light source was varied with an interval of 5 inches . Table 2 showed the number of bubbles generated by the aquatic plants under room lighting. Graph 1 summarizes all the result showing that as the distance of the light increases (decreasing intensity) the rate of photosynthesis decreases.
V. CONCLUSION The closer the light was to the aquatic plant, the greater light intensity it provided to it. This only says that greater light intensity accelerated the rate of photosynthesis as more bubbles were able to form.