Download
1 / 11
110 likes | 113 Views
This presentation discusses the development and use of water quality, quantity, and land cover indicators for environmental assessment. It includes information from various reports, such as The Heinz Center's State of the Nation's Ecosystems report and EPA's State of the Environment report. The presentation also highlights specific indicators related to streamflow, water use, and water quality, utilizing data from the USGS and other organizations.

E N D
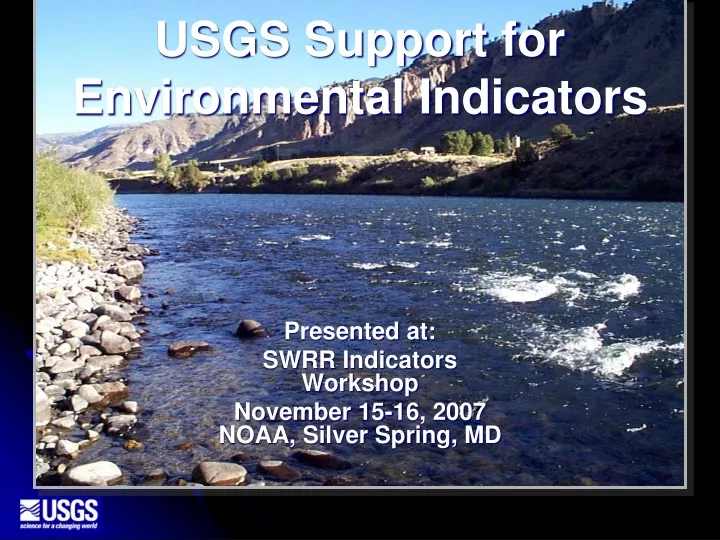
USGS Support for Environmental Indicators Presented at: SWRR Indicators Workshop November 15-16, 2007 NOAA, Silver Spring, MD
Development of Water Quality and Quantity Indicators • The Heinz Center’s State of the Nation’s Ecosystems report (2002, 2007) (29) • EPA’s State of the Environment report (2006) (8+) • Sustainable Water Resources Roundtable (SWRR) Indicators (~10)
For The Heinz Center State of the Nation’s Ecosystems Report, 2007 Streamflow Indicators (6) Change in recent (2002-2006) high flow compared to baseline (1941-1960) period
Total withdrawals in BGD U.S. Population in millions Water Use Indicators (5) U.S. Population in millions
For The Heinz Center State of the Nation’s Ecosystems Reports, 2002 and 2007 Water Quality Indicators (21) Five-Year Mean Annual Yields -Total Nitrogen
Potential New Aquatic Ecosystem Indicators-Stream Ecosystems are compared across the US Not Stressed in one or more categories Stressed in one or more categories Algae Inverts Fish Condition New England Coastal Basins Great Salt Lake Basin
Subcommittee on Ground Water Bob Schreiber, ACWI – ASCE Bill Cunningham, USGS Executive Secretary Chris Reimer, NGWA Monitoring Inventory Work Group Bill Cunningham, USGS Mike Wireman, USEPA Emery Cleaves, AASG Data Standards and Data Management Work Group Chuck Job, USEPA Field Practices Work Group Rod Sheets, USGSMike Nickolaus, GWPC Monitoring Network Work Group Bob Schreiber, ACWI- ASCE Quality Quantity Quality Quantity
USGS Ground-Water Resources Program Regional Water Availability Studies
Water-Level Change in the High Plains Aquifer, Predevelopment-2000 USGS, 2003, Circular 1243
Water data available from USGS http://waterdata.usgs.gov/nwis http://waterdata.usgs.gov/nwis
Land Cover Indicators • 18 Heinz Indicators use NLCD (National Land Cover Data, MLRC Consortium) • Many indicators rely on NLCD • New Land Cover Change product just released at www.mrlc.gov