Download
1 / 17
170 likes | 177 Views
Warm up 8/25. Find the intercepts of each line. (0, 9), (6, 0). 1. 3 x + 2 y = 18. 2. Find the equation of the linear function and graph. (–2, –3) and (2, 5). 3. State whether the relation is a function. Explain how you know. Homework Group Check in with your group!

E N D
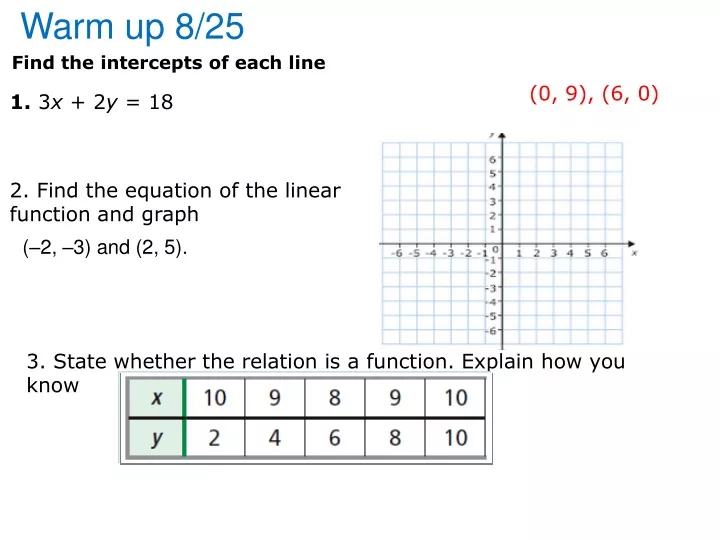
Warm up 8/25 Find the intercepts of each line (0, 9), (6, 0) 1. 3x + 2y = 18 2. Find the equation of the linear function and graph (–2, –3) and (2, 5). 3. State whether the relation is a function. Explain how you know
Homework Group Check in with your group! See which problems you have questions on Help your group member. Still unsure ? Thank about what you need to ask. Write those questions down. - Go over as a class.
Be seated before the bell rings Agenda: Warmup Go over hw p. 110 & 120 Quiz Note 2.5 DESK Warm-up (in your notes) homework • Quiz – today • Ch 2 test tues 9/1
Before the quiz: • Group Study: • 1.6 / 1.7 relations and function notation • ( back left) • 1.9 parent graphs ( back right) • 2.1/2.2 Solve equations/inequalities/ proportions • ( front right) • 2.3/2.4 Graph and write equations of linear function parallel and perpendicular lines • ( front left )
Notebook 1 Table of content 2.5 Linear inequalities Page 1) 1-1 Sets of Numbers /1.2 Properties of Numbers 1 2) 1-3 Square Roots 3) 1-4 Simplify Algebra Expression 4) 1.6 Relations/1.7 functions 5) 1.9 Parent Functions 6) 2.1 Linear Equations/ 2.2 Proportions 7) 2.3 & 2.4 8) 2.5 Inequalities Learning targets • 2.5 : I can graph linear inequalities in 2 variables • I can write a linear inequality that models a real-word problem and graph the inequality to represent the solutions.
2.5 Graphing Linear Inequalities Graphing linear inequalities, it is nearly the same as graphing linear equation. An equal sign below the inequality means we have a __________ line and no equal sign mean we have a __________. In order to solve we must___________ or we can _____________________
Dash Lines Solid Lines
2.5 Linear Inequalities inequality : a is less than b a is greater than b At least a is less than or equal to b At most
Example: Problem-Solving Application A school carnival charges $4.50 for adults and $3.00 for children. The school needs to make at least $135 to cover expenses. A. Using x as the adult ticket price and y as the child ticket price, write and graph an inequality for the amount the school makes on ticket sales. B. If 25 child tickets are sold, how many adult tickets must be sold to cover expenses?
1 Understand the Problem The answer will be in two parts: (1) an inequality graph showing the number of each type of ticket that must be sold to cover expenses (2) the number of adult tickets that must be sold to make at least $135 if 25 child tickets are sold. • List the important information: • The school sells tickets at $4.50 for adults and $3.00 for children. • The school needs to make at least $135.
Homework P 128; 9. 10, 22-35
Closer: Summarize what one person in your group learned in class today.