Download
1 / 1
10 likes | 119 Views
A sensor network, that like ivy, spreads through the environment and links leaves to the root. Ivy – A Sensor Network Infrastructure for the College of Engineering. Jaein Jeong, Lance Doherty and Kris Pister University of California at Berkeley Electrical Engineering and Computer Science.

E N D
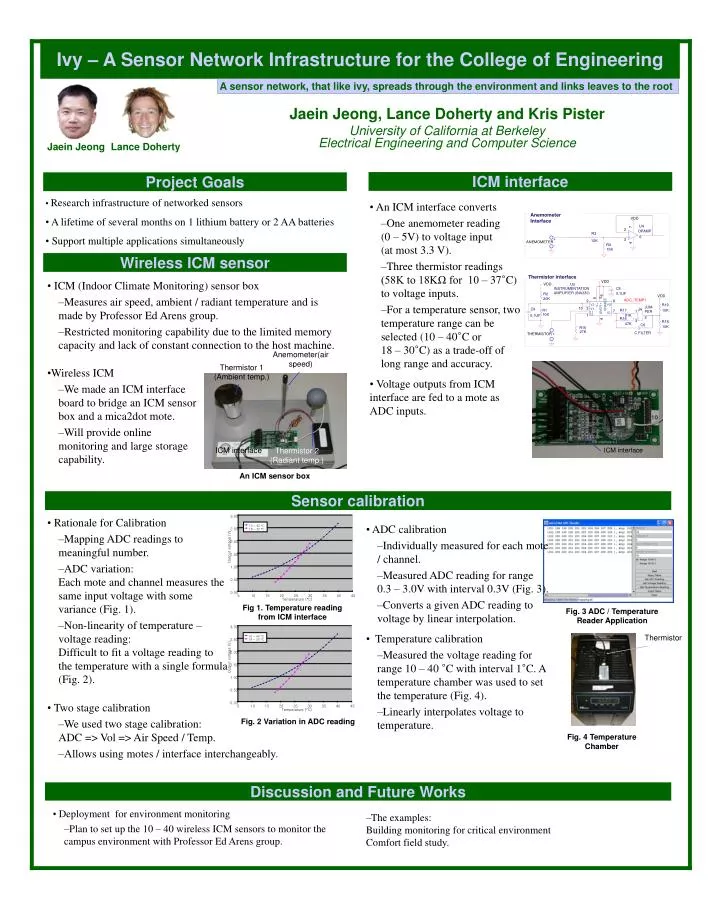
A sensor network, that like ivy, spreads through the environment and links leaves to the root Ivy – A Sensor Network Infrastructure for the College of Engineering Jaein Jeong, Lance Doherty and Kris Pister University of California at BerkeleyElectrical Engineering and Computer Science Jaein Jeong Lance Doherty ICM interface Project Goals • Research infrastructure of networked sensors • A lifetime of several months on 1 lithium battery or 2 AA batteries • Support multiple applications simultaneously • An ICM interface converts • One anemometer reading(0 – 5V) to voltage input(at most 3.3 V). • Three thermistor readings (58K to 18KΩ for 10 – 37°C) to voltage inputs. • For a temperature sensor, two temperature range can be selected (10 – 40°C or18 – 30°C) as a trade-off of long range and accuracy. • Voltage outputs from ICM interface are fed to a mote as ADC inputs. Anemometer Interface VDD U4 7 2 OPAMP - R3 6 + + 3 10K ANEMOMETER 4 R4 - 15K Wireless ICM sensor Thermistor interface • ICM (Indoor Climate Monitoring) sensor box • Measures air speed, ambient / radiant temperature and is made by Professor Ed Arens group. • Restricted monitoring capability due to the limited memory capacity and lack of constant connection to the host machine. VDD VDD U3 INSTRUMENTATIONAMPLIFIER (INA330) C5 0.1UF R2 6 VDD 5 9 20K ADC_TEMP1 2 8 V2 VO R19 ENABLE V+ V+ JUM-PER 10 3 C9 V1 J4 R1 R17 10K GND 7 1 I1 IO 10K I2 1 91K 0.1UF 2 R16 4 3 R18 47K C6 10K R15 27K C FILTER THERMISTOR 1 Anemometer(air speed) Thermistor 1(Ambient temp.) • Wireless ICM • We made an ICM interface board to bridge an ICM sensor box and a mica2dot mote. • Will provide online monitoring and large storage capability. ICM interface Thermistor 2(Radiant temp.) ICM interface An ICM sensor box Sensor calibration 3.00 • Rationale for Calibration • Mapping ADC readings to meaningful number. • ADC variation:Each mote and channel measures the same input voltage with some variance (Fig. 1). • Non-linearity of temperature – voltage reading: Difficult to fit a voltage reading to the temperature with a single formula (Fig. 2). • ADC calibration • Individually measured for each mote / channel. • Measured ADC reading for range 0.3 – 3.0V with interval 0.3V (Fig. 3). • Converts a given ADC reading to voltage by linear interpolation. • Temperature calibration • Measured the voltage reading for range 10 – 40 °C with interval 1°C. A temperature chamber was used to set the temperature (Fig. 4). • Linearly interpolates voltage to temperature. 10 – 40 °C 2.50 18 – 30 °C 2.00 Output voltage (V) 1.50 1.00 0.50 0.00 5 10 15 20 25 30 35 40 45 Temperature (°C) Fig 1. Temperature readingfrom ICM interface Fig. 3 ADC / TemperatureReader Application 3.00 Thermistor 10 – 40 °C 2.50 18 – 30 °C 2.00 Output voltage (V) 1.50 1.00 0.50 • Two stage calibration • We used two stage calibration:ADC => Vol => Air Speed / Temp. • Allows using motes / interface interchangeably. 0.00 5 10 15 20 25 30 35 40 45 Temperature (°C) Fig. 2 Variation in ADC reading Fig. 4 Temperature Chamber Discussion and Future Works • Deployment for environment monitoring • Plan to set up the 10 – 40 wireless ICM sensors to monitor the campus environment with Professor Ed Arens group. • The examples:Building monitoring for critical environmentComfort field study.