Download
1 / 22
220 likes | 399 Views
Increasing Cultural Competence in Oregon’s CDRC. Brian Rogers, MD Director Child Development and Rehabilitation Center Oregon Health & Science University. Oregon Splendor. Oregon Demographics US Census. Oregon estimated 2004 Population = 3,594,586 White 2,948,024 82.01%

E N D
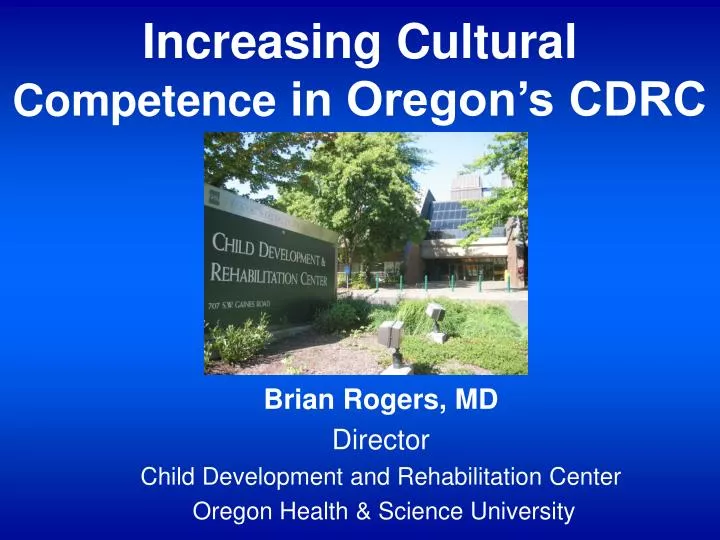
Increasing Cultural Competence in Oregon’s CDRC Brian Rogers, MD Director Child Development and Rehabilitation Center Oregon Health & Science University
Oregon Demographics US Census Oregon estimated 2004 Population = 3,594,586 • White 2,948,024 82.01% • Hispanic or Latino 343,278 08.00% • Asian 121,880 03.00% • Black or African American 64,117 01.60% • American Indian & Alaska Native 49,138 01.30% • Ntv. Hawaiian & Other Pac. Islander 9,630 00.20% • Some Other Race 150,972 04.20% • Two or More Races 83,225 03.10%
Oregon Reservations UMATILLA GRAND ROUDE CELILO VILLAGE WARMS SPRINGS SILETZ COOS BAY BURNS PAIUTE COQUILLE COW CREEK BAND OF UMPQUA KLAMATH FORT MCDERMT
National Survey of Children with Special Health Care Needs 2001 SLAIT Data Oregon vs. Nation for Uninsured X Race/Ethnicity of Child
Oregon vs. Nationwide SLAITS Data 2001 Estimate number of Self-Reported Children with Special Health Care Needs: 113,418 Prevalence By Race/Ethnicity Oregon % National % • Hispanic 8.3 8.6 • White (Non-Hispanic) 14.1 14.2 • Black (Non-Hispanic) * 13.0 • Asian (Non-Hispanic) — — 4.4 • Nt. American/Alaskan Nt. (Non-Hispanic) — — 16.6 • Nt. Hawaiian/Pac. Isld. (Non-Hispanic) — — 9.6 • Due to the small size of this group in the State population, data have been suppressed to protect respondents' confidentiality. — — Estimate has been suppressed because it does not meet the standard for reliability or precision.
Oregon vs. Nationwide SLAITS Data 2001 OUTCOME: Families of CYSHCN are partners in decision-making and satisfied with services
About CDRC Values • Family Centered Care • Self Determination • CULTURAL EFFECTIVENESS: recognizing, respecting and honoring the individual’s and family’s cultural values, language and traditions • Life Span and Holistic • Community Collaboration • Accountability • Collegiality
What We Do CDRC Clinical Services Oregon Institute on Disability & Development / UCEDD & LEND Oregon Center for Children and Youth with Special Health Needs
About the NCCC TA Visit Purpose: • For CDRC as an organization to commit to the work, process and change for increased cultural competence • Identify what we are doing well, what we aren’t doing that we should be doing, and what we can do better
Continuing Education Programat CDRC • CDRC Grand Rounds • CDRC Visiting Scholar Series
Structure of the NCCC TA Visit Individual sessions specific to: • Clinical Services • Oregon Center for CYSHN Community Outreach • Research and Public Health • Teaching & Training • Administration • University-Wide Issues
Photos from TA Visit University Presentation CDRC Presentation CDRC Presentation Administration
Direct Impact of the NCCC TA Visit • Knowledge of the diversity within our state broadened • Internal barriers and challenges were identified • Identification of small changes that have large impacts
Outcomes in Oregon Center for CYSHN • Families who live in rural areas report their needs are usually or always met • Partner with parents who reflect the diverse cultures in those communities • Partner with parents in community mapping of cultural resources • Continue needs assessment to include perspectives of diverse groups in Oregon
Outcomes in Teaching • Revised the specific Modules on cultural competency in our LEND curriculum • Revised the entire curriculum to ensure cultural issues in every module • Prioritized diversity forrecruitment and retention of staff and trainees
Outcomes in Clinical Services • Recruitment of bilingual staff in key positions • Continued use of personal interpreters in clinic settings • Improvement of ethnicity data collection
Outcomes in Administration • Develop a comprehensive plan to address recruitment (diversity and retention) • Staff annual performance reviews • CDRC Multicultural Council • Importance of cultural competency in our decision-making
Outcomes in Research • Cultural Competency checklist • Collaboration on research projects • High School Minority Projects and Summer Youth Program
CDRC’s Next Steps… • Monitor and celebrate our progress • Second TA from the NCCC • Strategic plan for organization • Plan of action • Plan of accountability • Continue to work with NCCC over the next 4 years
Summary CDRC knows Cultural and Linguistic Competence is a continuum • Create an organizational environment that values diversity • Better serve all children and families • Address cultural competence in our training • Conduct research that addresses cultural competence