Download
1 / 14
150 likes | 272 Views
RNA- seq Analysis Practical Exercise . (using the Galaxy public server) C redit: ‘ jeremy ’. FAQ about Using Galaxy for Transcriptome Analysis. http://main.g2.bx.psu.edu/u/jeremy/p/transcriptome-analysis-faq. DATA. small samples of datasets from the Illumina BodyMap 2.0 project

E N D
RNA-seq Analysis Practical Exercise (using the Galaxy public server) Credit: ‘jeremy’
FAQ about Using Galaxy for Transcriptome Analysis http://main.g2.bx.psu.edu/u/jeremy/p/transcriptome-analysis-faq
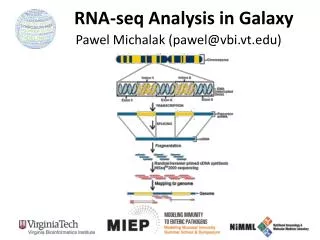
DATA • small samples of datasets from the Illumina BodyMap 2.0 project • paired-end 50bp reads from adrenal and brain tissues • reads map mostly to a 500Kb region of chromosome 19, positions 3-3.5 million (chr19:3000000:3500000)
1. QC and process • Use the [NGS: QC and manipulation >] FASTQ Summary Statistics • plot the output using the [Graph/Display Data >] Boxplot • Assume a median quality score of below 15 to be unusable Trim data if needed using : [NGS: QC and manipulation >] FASTQ Trimmer
2. Map processed reads to reference • Use the [NGS: RNA Analysis >] Tophat tool to map RNA-seq reads to the hg19 Canonical Female build. • a mean inner distance of 110 for • Look at the documentation to understand the two datasets that Tophat produces Question 2: How many splice junctions did Tophat find?
3. Visualize Tophat mappings Create a simple Galaxy visualization by selecting Visualization > New Track Browser from the main menu (top) • Create the visualization using the hg19 build and add datasets to your visualization by clicking on the Add Datasets to Visualization button. • Add • Tophat'saccepted hits BAM datasets • Tophat'ssplice junctionsdatasets • Gene annotation (3rd dataset)
3. Visualize Tophatmappings (2) You should see: • reads mapped by Tophat, including reads mapped across introns) • splice junctions produced by Tophat; and • How reads and junction correspond to annotated genes. Question 3: Find an example of a splice junction between 2 known exons, and find an example where a splice junction should be found but is not and take a screenshot for your report
4. Assemble transcripts • Look at Cufflinks docs to understand the data • Run [NGS: RNA Analysis >] Cufflinks on each BAM dataset produced by Tophat using de novo assembly • Add the Cufflinks' assembled transcripts datasets to the visualization you created Question 4: find examples where Cufflinks assembled a complete or almost complete transcript and again take a screenshot(s)
5. Merge transcripts • Run [NGS: RNA Analysis >] Cuffmergeon two datasets of assembled transcripts from Step 1 and use the UCSC genes annotation as the reference annotation • produces a merged transcripts dataset that includes all transcript in both datasets • needed in subsequent steps • Read the Cuffmerge documentation for more information.
6. Analyze transcripts • Run [NGS: RNA Analysis >] Cuffdiffon: • merged transcripts produced by Cuffmerge • accepted hits datasets • Peruse each dataset: browse the Cuffdiff documentation to get a sense of what they mean.
Analyse transcripts (2) Look at the transcript FPKM tracking dataset at the top of your history. QUESTION 5 - Find: • a novel isoform--class code 'j’ • an isoform that matches a reference isoform--class code '=’ • each transcript's FPKM value?
Analyse transcripts (3) Look at transcript differential expression testing dataset (second from the top of your history) QUESTION 6 - Find: • two transcripts that are differentially expressed • What are the p and q values for each and what do they mean?
Analyse transcripts (4) Question 7: • Identify all novel splice junctions and transcript isoforms in each set of transcripts. • Find some loci that exhibit differences in TSS and splicing.
Useful Links • Tophat documentation • Cufflinks/compare/merge/diff documentation • Nature Protocols paper describing RNA-seq analysis using Tophat-Cuff* pipeline • iGenomes data(annotations)