Download
1 / 28
310 likes | 543 Views
Multivariate Statistics for the Environmental Sciences . Peter J. A. Shaw Chapter 1 Introduction. 1.1 What is meant by multivariate stats?. What do stats do for us? Descriptive Stats Inferential Stats. Univariate Multivariate

E N D
Multivariate Statistics for the Environmental Sciences Peter J. A. Shaw Chapter 1 Introduction
1.1 What is meant by multivariate stats? • What do stats do for us? • Descriptive Stats • Inferential Stats
Univariate • Multivariate “Multivariate statistics tell you what you already know, but couldn’t quite put your finger on” Michael Usher
1.1.1 Why use multivariate stats? • Save time by reducing analytical work • Reduces the danger of misinterpreting random noise • Can be used to explore and describe data sets with many variables • Allows for the generation of a hypothesis • Suggests patterns to be found with relatively little work
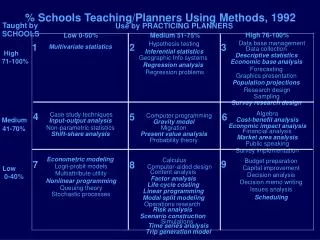
1.2 Scope of the Book • Explain application of multivariate techniques • Will not focus on data collection • 5 approaches that will be discussed: diversity indices, multiple regression, ordination, cluster analysis and canonical correspondence analysis • Chapter structure: • Introduce the technique • Apply the technique to small, model datasets to explain procedures • Show how multivariate stats contributes to environmental sciences
1.3 When to use multivariate stats • Don’t use when there is just one specific dependent variable responding to one defined factor • Refer to page 7 of Shaw for a list of common environmental research situations in which multivariate stats should/can be used
1.4 Computing Requirements Most of the multivariate techniques require the use of a computer, except diversity indices and Bray-Curtis ordination
1.5 Preparing the data; Points to consider • Types of data to collect • Avoiding pseudoreplication • Organization of the data matrix • Preliminary inspection of the data
1.5.1 Types of data to collect • Four different types of data, in order of increasing information content • Nominal data • Ordinal data • Continuous data • Interval data • Ratio data
1.5.2 Avoiding pseudoreplication • Defined by Hurlbert (1984) as: “the use of inferential statistics to test for treatment effects with data from experiments where either treatments are not replicated (though samples may be) or replicates are not statistically independent.” • Essentially, it is organizing the data in such a way that it appears more independent observations have been made than are actually the case.
1.5.3 Organization of the data matrix • Remember, computers are stupid, therefore you must pick up the slack! Properly format your data • Store data in a matrix (rectangular array of data) • Metadata
Points to consider in data organization Column organization • Classification variables • Metadata Missing values • Exclude the variable(s) • Exclude the observation(s)
Points to consider in data organization cont. Format errors • Format data so it is compatible with the requirements of the software packages used for analysis Recoding data • Only do inside the statistical package once the data matrix has been assembled • Collinear
1.5.4 Preliminary inspection of the data • GIGO: Garbage In Garbage Out • If the matrix data is odd or incorrectly entered, it will likely affect the analysis
Inspect data for outliers before analysis • Normal distribution • Multivariate normal distribution