Download
1 / 15
170 likes | 325 Views
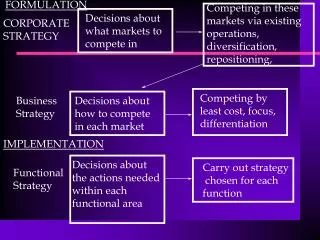
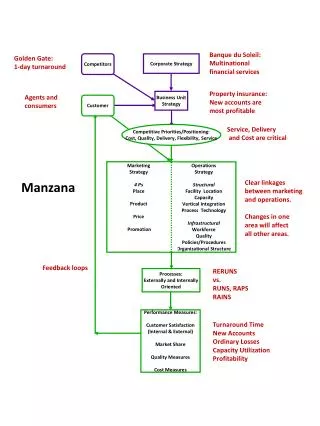
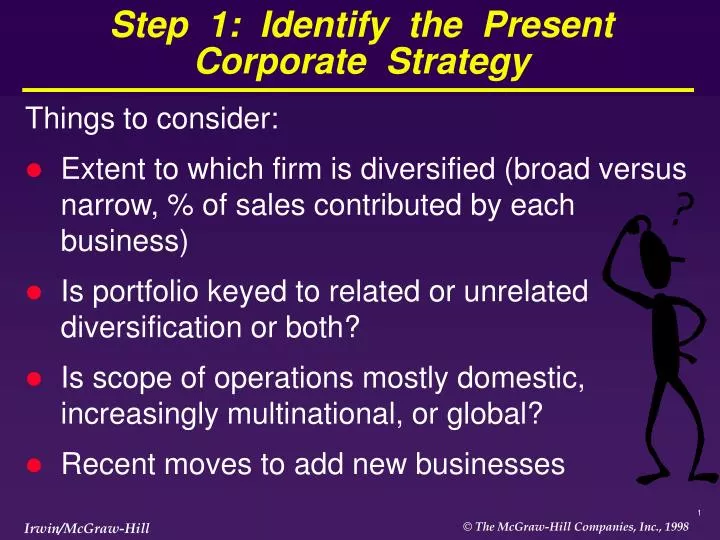
Step 1: Identify the Present Corporate Strategy. Things to consider: Extent to which firm is diversified (broad versus narrow, % of sales contributed by each business) Is portfolio keyed to related or unrelated diversification or both?

E N D
Step 1: Identify the PresentCorporate Strategy Things to consider: • Extent to which firm is diversified (broad versus narrow, % of sales contributed by each business) • Is portfolio keyed to related or unrelated diversification or both? • Is scope of operations mostly domestic, increasingly multinational, or global? • Recent moves to add new businesses
Step 1: Identify the PresentCorporate Strategy (cont.) • Recent moves to divest weak businesses • Actions to boost performance of key business units • Efforts to capture strategic fit benefits and use value chain relationships to create competitive advantage • Percentage of capital expenditures allocated to each business unit
Industry Attractiveness Factor Weight Attractiveness Rating Weighted Industry Rating Market size and projected growth 0.15 5 0.75 Intensity of competition 0.30 8 2.40 Emerging industry opportunities and threats 0.05 2 0.10 Social, political, regulatory, and environmental factors 0.05 6 0.30 Seasonality and cyclical influences 0.05 4 0.20 Resource requirements 0.15 7 1.05 Industry profitability 0.15 4 0.60 Degree of risk and uncertainty 0.10 5 0.50 Sum of weights 1.00 Industry attractiveness rating 5.90 Example: Rating IndustryAttractiveness Rating Scale: 1 = Unattractive; 10 = Very attractive
Competitive Strength Measure Weight Strength Rating Weighted Strength Rating Relative market share 0.20 5 1.00 Ability to compete on cost 0.25 8 2.00 Ability to match rivals on quality or service 0.05 2 0.10 0.10 6 0.60 Technology/innovation capabilities 0.05 4 0.20 How well resources match KSFs 0.15 7 1.05 Brand name reputation/image 0.10 4 0.40 Degree of profit relative to rivals 0.10 5 0.50 Sum of weights 1.00 Competitive strength rating 5.85 Example: Rating a Business Unit’s Competitive Strength Bargaining leverage Rating Scale: 1 = Weak ; 10 = Strong
Constructing anAttractiveness/Strength Matrix • Use quantitative measures of industry attractiveness and business strength to plot location of each business in matrix • Each business unit appears as a circle • Area of circle is proportional to size of business as a percent of company revenues (Or area of circle can represent relative size of industry with pie slice showing the company’s market share)
Representative Nine-Cell Industry Attractiveness-Business Strength Matrix Business Strength • Relative Market Share • Reputation/ Image • Bargaining Leverage • Ability to Match Quality/Service • Relative Costs • Profit Margins • Fit with KSFs Industry Attractiveness 10.0 6.7 3.3 1.0 Strong Average Weak • Market Size • Growth Rate • Profit Margin • Intensity of Competition • Seasonality • Cyclicality • Resource Requirements • Social Impact • Regulation • Environment • Opportunities & Threats High 6.7 Medium 3.3 Low 1.0 Rating Scale: 1 = Weak ; 10 = Strong
Strategy Implications of Attractiveness/Strength Matrix • Businesses in upper left corner • Accorded top investment priority • Strategic prescription is grow and build • Businesses in three diagonal cells • Given medium investment priority • Invest to maintain position • Businesses in lower right corner • Candidates for harvesting or divestiture • May be candidates for an overhaul and reposition strategy
Opportunity to combine purchasing activities & gain greater leverage with suppliers Opportunity to share technology, transfer technical skills, combine R&D Opportunity to combine sales & marketing activities, use common distribution channels, leverage use of a common brand name, and/or combine after-sale service No strategic fit opportunities Identifying Strategic Fits Among a Diversified Firm’s Business Units Value Chain Activities Inbound Logistics Technology Operations Sales and Marketing Distribution Service Business A Business B Business C Business D Business E
Step 5: Assess Resource Fit Objective: • Determine how well firm’s resources match business unit requirements • Good resource fit exists when • Businesses add to a firm’s resource strengths, either financially or strategically • Firm has resources to adequately support requirements of its businesses as a group
Checking for FinancialResource Fit • Determine cash flow and investment requirements of the business units • Are they cash hogs or cash cows? • Assessing cash flow aspects of each business • Highlights opportunities to shift financial resources between businesses • Explains why priorities for resource allocation can differ from business to business • Provides rationalization for both invest-and-expand strategies and divestiture
Characteristics of Cash Hogs • A business is acash hogwhen its internal cash flows are inadequate to fully fund its need for working capital and new capital investmentthe parent company has to continually pump in capital to “feed the hog” • Strategic options • Aggressively invest in attractive cash hogs • Divest cash hogs lacking long-term potential
Characteristics of Cash Cows • A cash cow business generates cash surpluses over and above what is needed to sustain its present market position • Such businesses are valuable because surplus cash can be used to • Pay corporate dividends • Finance new acquisitions • Invest in promising cash hogs • Strategic objective: Fortify and defend present market position--keep the business healthy!!!
Good versus Poor Financial Fit • A business has good financial fit when it • Contributes to achievement of corporate objectives • Enhances shareholder value • A business exhibits poor financial fit if it • Soaks up a disproportionate share of financial resources • Is an inconsistent bottom-line contributor • Is too small to make a sizable contribution to total corporate earnings • experiences a profit downturn that could jeopardize entire company
Checking for Competitive and Managerial Resource Fits • Involves determining whether • Resource strengths are well matched to KSFs of industries firm is in • Adequate managerial expertise exists to cope with problems of current businesses • Ability exists to transfer competitive capabilities from one business to another • Company must invest in upgrading its resources to stay ahead of rivals’ efforts to upgrade their resources
Notes of Caution: Why Diversification Efforts Can Fail • Transferring resource capabilities to new businesses can be far more arduous and expensive than expected • Trying to replicate a firm’s success in one business and hitting a second home run in a new business is easier said than done • Management can misjudge the difficulty of overcoming the resource strengths of rivals being confronted in a new business