Download
1 / 33
330 likes | 465 Views
Presentation of seasonally adjusted series. STESEG Task Force on Data Presentation and Seasonal Adjustment Bernard Lefrançois (presenter) June 29, 2004 . Background. Background Previous meetings STESEG 2003 Task Force meeting January 2004 E-mail discussions

E N D
Presentation of seasonally adjusted series STESEG Task Force on Data Presentation and Seasonal Adjustment Bernard Lefrançois (presenter) June 29, 2004
Background • Background • Previous meetings • STESEG 2003 • Task Force meeting January 2004 • E-mail discussions • Data and Metadata Presentation Manual • Distributed Lefrançois-Mamay paper not up-to-date • Discussion surrounding TF recommendations was not updated enough to reflect the actual recommendations • Recommendations 7, 8 and 12 contain editorial mistakes which are corrected in this presentation
Categories of use • Presentation tailored to audience • Usage more appropriate than Media • Useful number of categories: 3 • Categories (by size of audience) • General public • Informed users • Analytical users
General public • Interested in the main results only • e.g. Unemployment rate rose 0.2% • Dissemination vehicle • Press releases
Informed users • Interested in detailed results or methods • e.g. Unemployment rate by sex, regions, etc. • e.g. How a survey was carried • Dissemination vehicle • Comprehensive publication
Analytic users • Reprocess the data for their own uses • Need metadata • Disseminations vehicles • Database • Comprehensive publication
Using the categories • Categories are inclusive • e.g. Analytical users also are informed users and members of the general public • Categories may be useful in other contexts than presentation of s.a. data • e.g. Data and Metadata Presentation Manua
Recommendation 1 - context • Not all seasonal series provided by NSOs are seasonally adjusted • e.g. Canada, quarterly population estimates • General public cannot seasonally adjust on their own
Recommendation 1 When seasonality is present and can be identified, sub-annual indicators should be made available in seasonally adjusted form. The level of detail of indicators to be adjusted should be chosen taking into account user demand and cost-effectiveness criteria. The adjustment should be applied appropriately using the method chosen as a standard by the agency. The method used should be explicitly mentioned.
Recommendations 2 & 3 - context • Naming things • Three conflicting criteria • Precision • User-friendliness • General acceptance
Recommendation 2 When series are adjusted for seasonal variations, including trading-day effects and other regular calendar variations if present, they should be referred to as seasonally adjusted.
Recommendation 3 Series with no identifiable seasonal variations but with identifiable regular calendar variations, such as trading-days, should be so adjusted with the most appropriate techniques, and should be referred to as calendar adjusted. When no seasonal effects are contained in the raw series, the seasonally adjusted results are equal to the calendar adjusted figures. When no calendar effects are present in the raw series, the calendar adjusted results are equal to the raw data.
Recommendations 2 & 3 - discussion • Alternatives • “seasonally and trading-day adjusted” • “adjusted for seasonality, trading-day and variable holidays” • Bottom-line • Need a simple expression that say that a series has been adjusted for all identifiable calendar effects
Recommendation 4 - context • Various components series obtained from seasonal adjustment • Original (raw) • Trend-cycle • Seasonal • Trading-day • Variable holidays • Which one(s) for the general public?
Recommendation 4 When applicable, the focus of press releases concerning the main sub-annual indicators should be on their appropriately seasonally adjusted version. Where there is a user demand, the agency may also disseminate intermediate components of the seasonal adjustment process (e.g. series adjusted for calendar effects) but it should be clearly indicated that the focus is on the seasonally adjusted data.
Recommendation 5 - context • Sub-annual seasonally adjusted levels are sometimes “annualized” • i.e. “seasonnally adjusted at annual rates” • Quarterly series multiplied by 4 • Monthly series multiplied by 12 • Tradition for • National Accounts • Housing starts • For users • Hard to compare levels between programs • Often sum the four quarters instead of averaging
Recommendation 5 For sub-annual data expressed in levels, seasonally adjusted figures should be presented in their natural form; i.e. seasonally adjusted sub-annual data expressed in levels should not be grossed up and presented in annual terms.
Recommendation 5 - discussion • So ingrained, any hope of change? • No middle ground • OECD Economics Department is for annual rates • OECD Statistics Directorate is not • c.f. ECB (2003) “Press Releases on Quarterly National Accounts”
Recommendation 6 - context • Analytical transformations of s.a. series in press releases • Period-to-period changes • Period-to-period growth rates • Any other? • e.g. Year-over-Year growth rates? • e.g. Year-to-date totals?
Recommendation 6 Press releases presenting seasonally adjusted flow series should at the minimum provide the period-to-period change in levels and the period-to-period growth rate for the latest period.
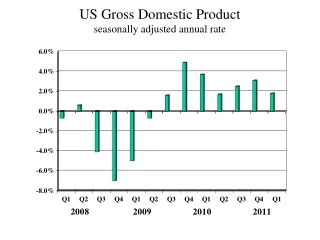
Recommendations 7 & 8 - context • Sub-annual growth rates of s.a. series are sometimes annualized • Quarterly growth rate compounded by 4 • i.e. (1 + r)4 • Tradition in the National Accounts • Some overlap with presentation of growth rates • Against • Did US GDP really grew by 8.2% in 2003-Q3? • Barely applicable to quarterly data, inapplicable to monthly data • Exaggerates the size of revisions
Recommendation 7 To present sub-annual growth rates at annual rates, annualized period-to-period growth rates should not be used.
Suggested recommendation 8 • It is recommended that the annualized semi-annual growth rates should be considered instead of the year-over-year ones as they react more quickly to current economic conditions, and as they are much less volatile than the annualized period-to-period growth rates. • For monthly data • Year-over-year growth rate • (xt/xt-12) - 1 • Annualized semi-annual growth rate • (xt/xt-6)2 - 1
Recommendations 7 & 8 - discussion • Task Force agreed that annualisation by compounding should be discouraged • TF did not reach an agreement on an alternative to satisfy users’ needs for a rate on an annual basis • e.g. Year-over-year growth rate, or • Annualized semi-annual growth rate • Alternatives need further study
Recommendation 9 - context • Frequent inquiries from the general public about the meaning of “seasonally adjusted” • Especially when the raw and seasonally adjusted data show divergent movements • Not always appropriately described in the press
Recommendation 9 Statistical agencies should disseminate a non-technical explanation of seasonal adjustment and its interpretation for the benefit of and aimed at the general public.
Recommendation 10 - context • There is no single commonly accepted measure of the validity of a seasonal adjustment applicable to various methods • Informed users often require this information • Availability is the exception instead of the rule • e.g. US Bureau of the Census publication Manufacturers’ Shipments, Inventories, and Orders
Recommendation 10 For the benefit of users requiring information about the validity of the seasonal adjustment applied, statistical agencies should provide a minimum standard of information facilitating an assessment of the reliability of each seasonally adjusted series.
Recommendation 10 - discussion • Paper suggests one presentation • TF did not find pertinent to recommend a particular presentation
Recommendation 11 - context • Analytical users may require to seasonally adjust related series • Important not to introduce statistical artefacts due to different seasonal adjustment options • Internal need for documentation
Recommendation 11 Statistical agencies should maintain and make available on request metadata on seasonal adjustment (i.e. the parameters of the adjustment) of sufficient extent to enable outside users to replicate the process.
Recommendation 12 • There is no standard format for exchanging the parameters used for seasonal adjustment • For outside users (as per Recommendation 11) • Between seasonal adjustment software • i.e. X-12-Arima, Tramo-Seats, etc. • A recommendation was presented to the TF • TF agreed that this issue was outside the scope of its work • The TF suggests instead that the OECD should pursue this issue through SDMX
Questions to STESEG • Following Recommendation 6, should the TF review other analytical transformations? • e.g. appropriateness of year-to-date totals? • Following Recommendations 7 & 8, should the TF study further appropriate forms of annualisation? • Following Recommendation 10, should the TF propose a minimum standard of information on the validity of a seasonal adjustment? • Are there other issues regarding the presentation of seasonally adjusted series that should be reviewed by the Task Force? • Discussion of the recommendations