Download
1 / 7
70 likes | 144 Views
Level 2 Algorithm. Definition of Product Levels. Science Algorithm Levels. Level 1 1A: Reconstructed instrument data 1B: Instrument units at TOA RFI Flag Avg over one cal cycle (1.44 sec) Level 2 2A: T A at TOA to surface Flags (solar flares, rain, land, etc)

E N D
Science Algorithm Levels • Level 1 • 1A: Reconstructed instrument data • 1B: Instrument units at TOA • RFI Flag • Avg over one cal cycle (1.44 sec) • Level 2 • 2A: TA at TOA to surface • Flags (solar flares, rain, land, etc) • Faraday rotation correction • Antenna pattern correction • Geophysical parameters removed • TA at surface each 1.44 sec • 2B: TB at surface to SSS • Roughness correction • SST + model function (Klien-Swift) • Avg to 5.76 sec • Level 3: Time-space averaged SSS on standard earth-projection • 3A: 7 day and monthly at 1 degree • 3B: 7 day and monthly at 150 km L1 L2A L2B L3
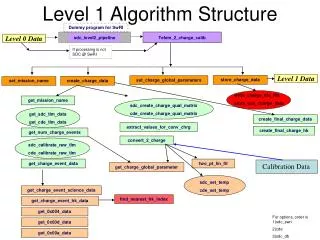
Algorithm Modules: Level 2 • Input from L1B: Antenna temperature avg at 1.44 sec • Flags • Flag Solar Flares • Rain Flag • Land Contamination, sea ice • Excessive winds, foam • Unusual Antenna Temperature • Antenna Pattern Correction • Remove off-earth contribution (galactic, sun, limb) • Tearth = Tmeasured + Tspace • Correct for Faraday rotation • Compute effective Brightness at boresight • Tbv = A11 T1 + A12 T2 • Tbh = A21 T1 + A22 T2 • Remove Geophysical Contributions • Atmospheric up/down welling and Attenuation • Reflected galactic and sun • Correct for land contamination (optional) • Convert Sea-Surface Brightness Temperature to Salinity • Roughness correction • SST • Model function: SSS = F(SST, TB, θ): Klien & Swift; Wentz • Average to d5.76 sec
Level 2A Radiometer Geolocated & Calibrated Sensor Units at Surface A. At 1.44 sec working average Flags: Solar Flares, Rain, Land, Sea Ice, Excessive Wind, Foam, Unsual TB Corrections Faraday Rotation Galactic Background Atmospheric Attenuation and Emission Sun and Moon Antenna Pattern Correction B. Output: Geolocated and Calibrated sensor units Th and Tv at the surface One value for each 1.44 sec
Level 2B Radiometer Geolocated SSS averaged to 5.76 sec A. TB at 1.44 sec Roughness Correction (for TB): Using Scat data (Algorithm provided by Scat) Alternative: Using local wind speed and/or sea state Average: One data point per 5.76 sec Located at center • Convert to Salinity Klein & Swift model or latest version • Output: Salinity at center of geolocated pixels One pixel per 5.76 sec. All Flags Quality flag (error estimate in salinity units)
Level 2 ScatterometerRoughness Correction at 5.76 sec A. Scatterometer Output NRCS (σ0) colocated at 1.44 sec with radiometer data Roughness Correction (σ0 to TB): Algorithm derived pre-launch Revised post-launch using scat data and surface truth Wind direction Assess importance and if necessary collect ancillary data B. Other Scatterometer Output NRCS at 5.76 sec with flags and quality index (Kpc) Other • Archived Output: NRCS at 1.44 and 5.76 sec Flags and quality index Ancillary data (wind speed and surface roughness) Algorithm