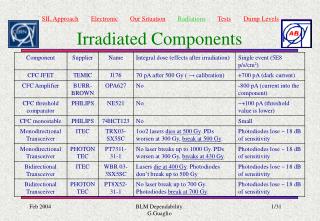
Download
1 / 16
160 likes | 274 Views
Photoresponse spectrum in differently irradiated and annealed S i. Juozas Vaitkus Vilnius University, Lithuania On behalf of PC spectra group: V.Kalendra, V.Kazukauskas and N.Vainorius, and the lifetime group: E.Gaubas. Outline:.

E N D
Photoresponse spectrum in differently irradiated and annealed Si Juozas Vaitkus Vilnius University, Lithuania On behalf of PC spectra group: V.Kalendra, V.Kazukauskas and N.Vainorius, and the lifetime group: E.Gaubas J.Vaitkus. WODEAN Workshop,13-15 May, 2010, Bucurest
Outline: • Photoconductivity spectra in differently irradiated and annealed (according the WODEAN plan) samples • Model of photoconductivity (the cluster properties included) J.Vaitkus. WODEAN Workshop,13-15 May, 2010, Bucurest
Photoconductivity spectrum gives information: • Constant excitation: • Intrinsic region – the signal related to the free carrier lifetime, i.e. recombination efficiency. • Extrinsic region – the signal gives information about the deep levels • Pulse excitation (40 fs) (microwave measurement) • Photo-ionization rate • Recombination (capture) time constant J.Vaitkus. WODEAN Workshop,13-15 May, 2010, Bucurest
Non-annealed PC Most surprising: non-monotonous change the contribution of different deep levels: it is an evidence of the random processes in defect generation J.Vaitkus. WODEAN Workshop,13-15 May, 2010, Bucurest
1e13 cm-2 • Annealing influences the lifetime (at the beginning the increase, later – decrease) • Annealing decrease the level at the valence band concentration (DEopt~0.9 eV) J.Vaitkus. WODEAN Workshop,13-15 May, 2010, Bucurest
1e14 cm-2 • Annealing influences the lifetime (at the beginning the increase, later – decrease) • Annealing decrease the the level at the valence band concentration (DEopt~0.9 eV), but at higher T – the defect system reconstruction J.Vaitkus. WODEAN Workshop,13-15 May, 2010, Bucurest
1e16 cm-2 Annealing increase the lifetime Annealing caused the complicate influence on deep level concentration J.Vaitkus. WODEAN Workshop,13-15 May, 2010, Bucurest
40 fs pulse excitation, RT The difference of dc 18 K and pulse @ RT: more shallow levels are observed the quenching is more significant. Annealing reduced quenching by 0.41 eV and the contribution of most deep levels (probably disorder origin), but enhanced level at 0.82 eV. J.Vaitkus. WODEAN Workshop,13-15 May, 2010, Bucurest
All results can be understood by the cluster transform model: 1) the kick off by neutron Si atom creates the vacancy-interstitials cluster (Huhtinen – track consisting vacancies and Si disorder).2) the generation-recombination induced phonons and low temperature annealing leads to the cluster reconstruction to the different vacancy clusters and the gettering of other defects. J. Dong, D. A. Drabold. Atomistic Structure of Band-Tail States in a-Si. Phys. Rev. Lett. Vol. 80 (9) p. 1928-1931 (1998). The valence tail isprimarily due to structural disorder, while the conductiontail is much more sensitive to temperature and originatesin thermal disorder. J.L. Hastings, S.K. Estreicher, P.A. Fedders. Vacancy aggregates in silicon. Phys. Rev. B, Vol. 56 (16), p. 10215-10220 (1997). J.Vaitkus. WODEAN Workshop,13-15 May, 2010, Bucurest
0.05 m Initial distribution of vacancies produced by 1 MeV neutron in Si, a – a result of kick of Si atom, and b – if a fluence was 1014 cm-2, according M.Huhtinen. NIMA 491 (2002) 194–215 Simulation review: G.Davies, presentation at the WODEAN workshop in Bucharest: reconstructions inside 100 nm size volume (all inside the Debye sphere) J.Vaitkus. WODEAN Workshop,13-15 May, 2010, Bucurest
Photo-ionization of the cluster Different deep levels onside the volume surrounded by a single potential barrier. E Annealing change the compensation in the bulk, i.e., barrier, and the structure (i.e., properties) of deep levels inside the cluster. x J.Vaitkus. WODEAN Workshop,13-15 May, 2010, Bucurest
The talk of Gordon Davies in Bucharest demonstrated that the main transforms during self-annealing and different treatment are going inside the cluster where different random processes happens. Conclusion 1: Our results show that by photoconductivity a the changes in the deep level system can be controlled. The positive and negative contribution on the photoconductivity allow to recognize the levels that influence the carrier capture by the cluster. J.Vaitkus. WODEAN Workshop,13-15 May, 2010, Bucurest
Conclusion 2: Irradiation and low T annealing effect demonstrate: • Extrinsic photoconductivity reveals a few deep levels that are directly related to the irradiation. • Low T annealing allows to propose the random transforms in the defect system 10 J.Vaitkus. WODEAN Workshop,13-15 May, 2010, Bucurest
Thanks for Your attention ! J.Vaitkus. WODEAN Workshop,13-15 May, 2010, Bucurest
The comparison of the acting quantities confirming the model 1) Fermi level location determined from the free carrier concentration (proposing the existence of the conductivity channels, the error related to the indefinite of the volume participating in the percolation) 2) Local level energy is determined from the temperature dependence of the free carrier concentration. 3) The Debye radius is evaluated neglecting the ionized defects between the clusters. (If it would be included, the overlap would be less) 4) The cluster separation distance evaluated using the approximation of linear dependence of the cluster concentration on the fluence. J.Vaitkus. WODEAN Workshop,13-15 May, 2010, Bucurest
Other series samples J.Vaitkus. WODEAN Workshop,13-15 May, 2010, Bucurest