Download
1 / 22
220 likes | 328 Views
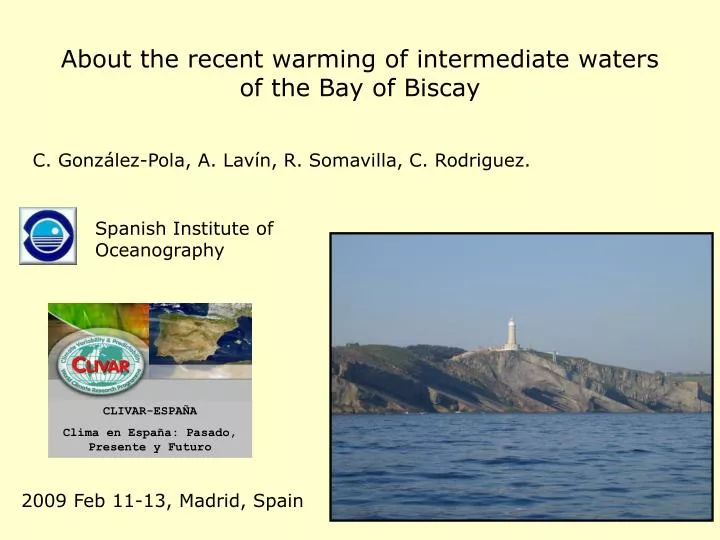
CLIVAR-ESPAÑA Clima en España: Pasado, Presente y Futuro. C. González-Pola, A. Lavín, R. Somavilla, C. Rodriguez. About the recent warming of intermediate waters of the Bay of Biscay. Spanish Institute of Oceanography. 2009 Feb 11-13, Madrid, Spain .

E N D
CLIVAR-ESPAÑA Clima en España: Pasado, Presente y Futuro C. González-Pola, A. Lavín, R. Somavilla, C. Rodriguez. About the recent warming of intermediate waters of the Bay of Biscay Spanish Institute of Oceanography 2009 Feb 11-13, Madrid, Spain
Introduction. Warming in the Eastern North Atlantic Fact: Upper layers of the North Atlantic are warming. Recent strong warm anomalies Hollyday et. al (2008) Upp T > 0.1ºC from 2000 Johnson & Gruber (2007) SPMW 0.7ºC 1993-2003 Thierry et. al (2008) SPWW 1.4ºC 1996-2003 Recent strong warm anomalies Hollyday et. al (2008) Upp T > 0.1ºC from 2000 Johnson & Gruber (2007) SPMW 0.7ºC 1993-2003 Thierry et. al (2008) SPWW 1.4ºC 1996-2003 Recent strong warm anomalies Hollyday et. al (2008) Upp T > 0.1ºC from 2000 Johnson & Gruber (2007) SPMW 0.7ºC 1993-2003 Thierry et. al (2008) SPWW 1.4ºC 1996-2003 Long term warming trends Arbic & Owens (2001) 0.005ºC/yr [1920s to 1990s] Levitus et. at. (2005) 0.006ºC/yr [1955 to 2003] Potter & Lozier (2004) MW 0.010 ºC/yr [1955 to 2003]
http://www.seriestemporales-ieo.net/ The Radiales Project. The Santander Standard Section Bay of Biscay: Adjacent Sea of the Eastern North Atlantic. Weak circulation. Radiales Project: Systematic sampling (hydrographical and biological in 8 standard sections around Spanish waters). Monthly sampling in the Galician-Cantabrian area. • Santander Section. 7 stations, 1 in the shelf break, two over the deep ocean (2400 and 2800) • Small ship, sampling limited to 1000m depth (1500 from 2006). High frequency timeseries of central water properties.
Sustained warming at all depths From early 90`s all water masses have warmed at rates 0.015-0.030 ºC/yr. (0.020 ºC/yr on average. 0.30ºC in 15 years) Different water masses (different sources and pathways) and different types of warming. Possible to look to the interannual variability and strong shifts (climatic signals).
Water masses in the Bay of Biscay East North Atlantic Central Water (ENACW). ~27.1-2 Pres ~ 350 dbar Lower bound of ENACW (Sal Min). ~27.2-3 Pres ~ 500 dbar Mediterranean Water (MW). ~27.3-27.6 Pres ~ 1000 dbar (core) MW present a smooth slow-varying structure a the eastern Bay of Biscay Lavín et. al. 2006
Quantifying water masses changes It is possible to split changes at a fixed depth approximately in two main components (Bindoff & McDougall 1994, Arbic & Owens, 2001) : • Thermohaline properties variation at fixed isopycnal levels. Pure Warming//Freshening.[air-sea fluxes variability] • Variations due to vertical displacement of isopycnal levels. Pure Heave. [renewal rates, circulation changes] 2 Approximate expression: Heating at isobaric levels “isobaric change” 2 1 Heating at isopycnal levels “isopycnal change”. Modification of the thermohaline structure of the water masses Heating due to isopycnal level displacement “heave”. ‘Same water types’ but different proportions. 1
Isopycnal sinking (heave). St7 27.1-27.2 ➯ Significant and progressive sinking until 2005. ENACW Sal Min 27.3-27.6 ➯ fairly stable MW
Thickness of the layers (heave). St7 27.1// 27.2 ➯Stable (slight non-significant reduction). Sudden increase in 2005. 27.2// 27.3 ➯ Strong reduction (~7 dbar yr-1). Restoration in 2005. ENACW Sal Min 27.3// 27.4 ➯ Slight reduction MW 27.3-27.6 ➯ fairly stable
ENACW Sal Min MW Θ between isopycnals (isopycnal change), same for salinity! 27.1// 27.2 ➯ Interannual variability (not a trend) 27.2// 27.3 ➯ No change at all until 2005. Then strong termohaline change 27.3-27.4 ➯ progressive isopycnal warming (thus salt-increase). Enhanced after 2005. 27.4-27.6 ➯ progressive isopycnal warming. Continued pattern.
Overall View, S temporal evolution 2005 onwards ENACW: ↕Heave+isop. ↓ → ↑ Sal. Min. ↑ Isop MW ↑ Isop 1992 to 2005 ENACW: ↑ Heave+isop. 4:1 + Sal. Min. ↑ Heave MW ↑ Isop.
cooling NCEP/NCAR Reanalysis Sea Level Pressure (mb) anomaly. Dec04-March05. warming NE Winds Dry Interpretation of the changes. ENACW & Sal. Min. Winter 2005 anomalous atmospheric pattern Somavilla et al., 2009.
Freshwater equivalent in salinity anomaly matches with P-E Interpretation of the changes. ENACW & Sal. Min. Cells for air-sea fluxes calc. NCEP/NCAR Reanalysis http://www.cdc.noaa.gov Winter [and yearly] air temperature always above average since early 90’s. No trend in air-sea heat exchange. From early 90’s to 2004: ENACW modal water progressively more lighter (warm) 27.2 ➯ 27.1 In 2005: Local high heat loss + strong precipitation deficit. 27.1 ➯ 27.2++ (warmer+saltier). An isolated cooling + mixing event after years of heave transmitted downwards the warm anomaly (as isopycnal warming, i.e. within salt-increase).
Western Mediterranean deep water formation: Parallelism. Western Mediterranean (Deep Water source). Highest heat flux loss anomaly on record (Lopez-Jurado et. al. 2005). 2004 2005 2006 An isolated cooling + mixing event (deep water formation event) after years of sustained warming and salt-increase transmitted downwards the warm anomaly.
Tracking climatic signals at MW in the Bay of Biscay? • MW have a clear pathway until the Galician Bank and less clear into the Bay of Biscay. MW at Biscay could take 15-25 months to reach Santander directly from the MW source, or could mainly come from the main reservoir. Colas (2003) Bower et.al. (2002) Iorga & Lozier (1999)
Tracking climatic signals at MW in the Bay of Biscay? • MW have a clear pathway until the Galician Bank and less clear into the Bay of Biscay. MW at Biscay could take 15-25 months to reach Santander directly from the MW source, or could mainly come from the main reservoir. • MW changes during 90`s until 2005 did not come from mixing from above (i.e were advected). • MW forms at the Gulf of Cadiz (MOW+ENACW, 1:3, Baringer & Price 1997). Santander MW core contains about 40% of original. • 90’s to 2004 (at least) MOW warmed continuously (Millot et.al 2006), as ENACW did. • 2005 onwards, MOW cooled (Lafuente et. al. 2007). Upper ENACW cooled while core and lower ENACW warmed (Santander results). … suggest that the 2005 cooling event may have produced a signature at Santander MW.
Tracking climatic signals at MW in the Bay of Biscay? No signs of cooling at MW until 2008. Warming at MW evolves as plateaus and stepsnot clearly correlated to shifts in Central Waters. MW warming as: a) The smoothed outcome of the continuous overall warming of its constituents. b) The overall large-scale MW warming at the Eastern Atlantic reservoir. T at MW ~27.4-5 T at ENACW ~27.1-2 T at Sal.Min. ~27.2-3 T at ENACW 200-500 dbar
Conclusions • Central waters down to 1000 m in the southern Bay of Biscay have suffered strong and progressive modifications from early 90’s, with the effect of a generalized warming at all levels at rates from 0.015 ºC yr-1 to 0.030ºC yr-1. • Central waters variability are well correlated with local air-sea fluxes. (We could blame global warming for this ‘local warming’ as far as we blame global warming for decades of high temperatures). • Winter 2005 provided a strong local cooling. The effect was the isopycnal warming of deep levels fairly stable until then (at most warming by heave). Western Mediterranean experimented something similar. • MW at the Bay of Biscay continues a progressive warming and salinity increase (density compensating) without a tight response to short-term climatic signals.
1992 to 2005 ENACW: Warming mainly due to isopycnal sinking (heave). 1992 to 2005 Salinity Minimum: Warming purely by heave until 2005. 2005 onwards Salinity Minimum: isopycnal warming while weak cooling by heave 2005 onwards ENACW: Sudden isopycnal cooling and quick recovery Overall View 1994 to 2005 MW: Warming due to termohaline changes (isopycnal sinking represents 10:1) 2005 onwards MW: Same at upper MW, unclear at the core.
Related to heat and freshwater fluxes at the formation areas. water formed is ‘different’ Quantifying water masses changes Water masses analysis: Two natural components: • Effective modification of the thermohaline structure of the water masses (θS diagram alteration).
Related to variations in renewal rates or circulation changes. ‘Same water types’ but different proportions. Quantifying water masses changes Water masses analysis: Two natural components: • Vertical displacement of isopycnal levels without changes in water masses properties.
Salinity between isobars (st7) 200//400 ➯ Strong interannual variability 400//600 ➯ No salinity change Salinity increase below 400 dbar (first time observed) 600//1000 Progressive increase