Download
1 / 27
270 likes | 348 Views
UofT Engineering Finance Association Finance 101. DCF Analysis. Kelvin Xu Slides prepared by: Asthon Wu, Garrett Kuhlmann. Introduction. UTEFA. Need to learn theory of DCF before learning how to use the spreadsheet The Forecasting Period & Forecasting Revenue Growth

E N D
UofT Engineering Finance Association Finance 101 DCF Analysis Kelvin Xu Slides prepared by: Asthon Wu, Garrett Kuhlmann
Introduction UTEFA • Need to learn theory of DCF before learning how to use the spreadsheet • The Forecasting Period & Forecasting Revenue Growth • Forecasting Free Cash Flows • Calculating the Discount Rate • The Fair Value
Background UTEFA • Projects how much money a company will make in the future • Determines a fair price based on this projection • “Time value of money” • Several approaches: free cash flow to equity, dividend discount model, cash flow to firm
The Forecast Period UTEFA • Need to determine how far into the future to project cash flows (the forecast period)
Revenue Growth Rate UTEFA • One of the most important assumptions one can make about the company’s future cash flows • Consider future of company and market • What does the company predict? • Is the market expanding or contracting?
Example UTEFA • Company predicts revenue to grow by 20%, but has been growing consistently at 10% in the past
Free Cash Flow UTEFA • The actual amount of cash a company has left from its operations to enhance shareholder value • Development of new products, or paying dividends
Alternate Formula UTEFA
Operating Costs UTEFA • COGS, SG&A, R&D • Look at historic operating cost margin • Can decrease due to efficiency improvements • Can increase due to price adjustments to stay competitive
Example UTEFA • Operating cost margin of 70% for three years • Company says cost cutting will push down operating cost margin to 60% over 5 years • Make an educated prediction
Tax Rates UTEFA • Many companies do not actually pay corporate tax rate due to tax breaks • Look at average tax paid over past few years as a prediction for future tax rates
Net Investment UTEFA • E.g. NetInv-2 = NetInv-3 = 10% of revenues • CAPEX-1 = $10M with Dep = $3M • => NetInv0 = $7M = 7% of revenues
Change in WC UTEFA • Cash required for day-to-day business operations • Increases as sales revenue grow
FCF UTEFA
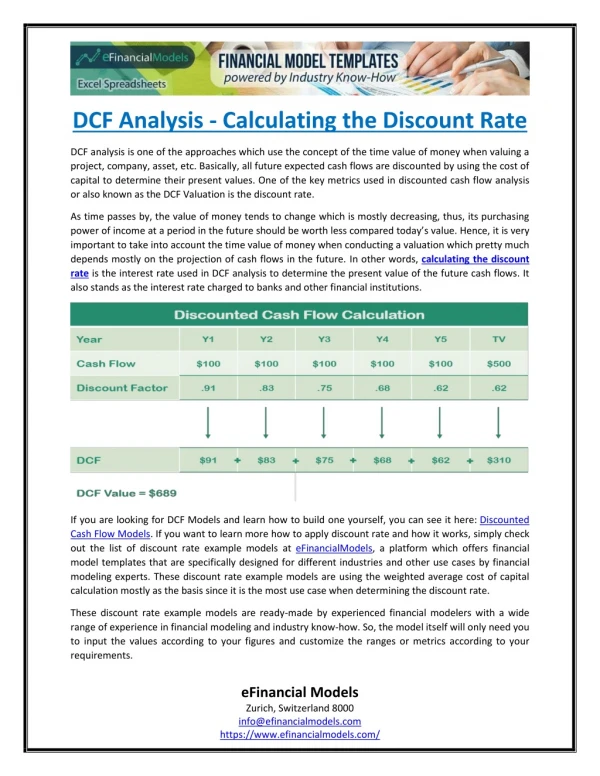
Discount Rate UTEFA • We need to discount the projected free cash flows to find out what they are worth today • This discount rate is different for every company • We discount the cash flows at the Weighted Average Cost of Capital (WACC)
Discount Rate UTEFA • Re = cost of equity Rd = cost of debt E = market value of the firm's equity D = market value of the firm's debt V = E + D E/V = percentage of financing that is equity D/V = percentage of financing that is debt Tc = corporate tax rate
Cost of Equity (Re) UTEFA • Investors generally wish to receive a premium for investing their money in the company • Use Capital Asset Pricing Model to find this value • Re = Rf + β(Rm – Rf)
Cost of Equity (Re) UTEFA • Re = Rf + β(Rm – Rf) • Beta may be found on any finance website and is a measure of how correlated the companies stock price is with the market • Rf is the Risk Free Rate • Rm is the rate of return on the market
Cost of Debt (Rd) UTEFA • Rd may usually be found on a companies financial statements • Tells the investor what rate the company borrows at • If it is not in the financial statements, it may be estimated from similar companies
WACC UTEFA • Suppose The Widget Company has a capital structure of 40% debt and 60% equity, with a tax rate of 30%. The borrowing rate (Rd) on the company's debt is 5%. The risk-free rate (Rf) is 5%, the beta is 1.3 and the risk premium (Rp) is 8%. The WACC comes to 10.64%.
Terminal Value UTEFA • To forecast the companies growth into the future, we use the Gordon Growth Method: • Terminal Value = Final Projected Year Cash Flow X (1+Long-Term Cash Flow Growth Rate) (Discount Rate – Long-Term Cash Flow Growth Rate)
Terminal Value UTEFA • Assume that the company's cash flows will grow in perpetuity by 4% per year. At first glance, 4% growth rate may seem low. But seen another way, 4% growth represents roughly double the 2% long-term rate of the U.S. economy into eternity. • Widget Company Terminal Value = $21.3M X 1.04/ (11% - 4%) = $316.9M
Enterprise Value UTEFA • We have forecasted five years of short term growth, plus found the terminal value of the company • Now we need to piece it all together to find the total value of the company
Enterprise Value UTEFA • Discount all the free cash flows using the WACC to find the Net Present Value (NPV) of the flows • EV = ($18.5M/1.11) + ($21.3M/(1.11)2) + ($24.1M/(1.11)3) + ($19.9M/(1.11)4) + ($21.3M/(1.11)5) + ($316.9M/(1.11)5) EV = $265.3M
Fair Value UTEFA • Need to account for the debt that a company has • As investors, we are only purchasing equity of a company so we subtract the debt that the company has on its balance sheet • Fair Value of Widget Company Equity = Enterprise Value – Debt
Fair Value UTEFA • After we find the fair value for the company, divide that number by the amount of shares outstanding to find the share price • Say the Widget Company had no debt, and 2 million shares outstanding: • 265.3 M/2 M = 132.65$ per share fair value