Download
1 / 44
440 likes | 540 Views
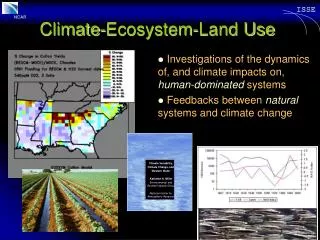
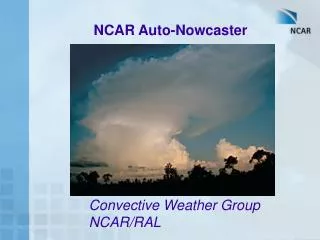
Update on NCAR Auto-Nowcaster. Juneau, AK. The Auto-Nowcaster System. An expert system which produces short-term (0-1 hr) forecasts of thunderstorm initiation, growth and decay using fuzzy logic.

E N D
Update on NCAR Auto-Nowcaster Juneau, AK
The Auto-Nowcaster System • An expert system which produces short-term (0-1 hr) forecasts of thunderstorm initiation, growth and decay using fuzzy logic. • Recent developments have allowed human users (i.e. forecasters) to input information into the system in a relatively quick and simple fashion. • A test of the updated system in an operational environment is taking place at the Dallas/Fort Worth WFO.
The Auto-Nowcaster System is unique in its ability to providenowcasts of storm initiationby….. Detection and extrapolation of surface convergence boundaries …. ….that trigger thunderstorm initiation and impact storm evolution.
Initiation nowcasts extrapolation nowcasts Example of Auto-Nowcaster Initiation Forecast 1 hour forecast Verification
Flow Chart for the Auto-Nowcaster System Forecaster Input Data Sets Radar WSR-88D Satellite Mesonet Profiler Sounding Numerical Model Lightning Predictor Fields Analysis Algorithms Fuzzy Logic Algorithm - Membership functions - weights - Combined likelihood field Final Prediction
Flow Chart for the Auto-Nowcaster System Forecaster Input Data Sets Radar WSR-88D Satellite Mesonet Profiler Sounding Numerical Model Lightning Predictor Fields Analysis Algorithms Fuzzy Logic Algorithm - Membership functions - weights - Combined likelihood field Final Prediction
Membership Function Yes Convergence line Likelihood .5 .5 Lifting Zone Likelihood No 0 Lifting Zone Example of fuzzy logic Predictor Field 1
Membership Function Convergence .1 Likelihood .2 .3 .2 Likelihood .1 Convergence Predictor Field 2
Predictor Field 3 Membership Function Cumulus clouds 1 Likelihood .8 -.5 .4 .4 Likelihood -.5 -.5 -1 Cumulus cloud type
Weight 1 Weight 2 Weight 3 Likelihood 1 Likelihood 3 Likelihood2 Σ Final combined likelihood of initiation
Predictor Fields used for Combined Likelihood of Initiation Blue Regions - Little chance of storm development Green Regions - Moderate likelihood Red Regions - Areas of forecast initiation • Environmental conditions (RUC) • Frontal likelihood • Layered stability • CAPE (max between 900 and 700 mb) • Mean 875 to 725 mb Relative Humidity • Boundary-layer • Convergence • LI (based on METARS) • Vertical velocity along boundary (maxW) • Boundary-relative steering flow • New storm development along boundary • Clouds • Clear or Cumulus • Vertical develop as observed by drop in IR temps
60 Minute Initation (rules with satellite data) Wt: 0.10 Range: 0 to 0.10 Wt: 0.17 Range: -0.085 to 0.17 Wt: 0.20 Range: -0.20 to 0.02 Wt: 0.17 Range: -0.17 to 0.17 Wt: 0.08 Range: -0.02 to 0.08 Wt: 0.16 Range: -0.08 to 0.16
60 Minute Initation (rules with satellite data) Cont. Wt: 0.20 Range: -0.2 to 0.2 Wt: 0.20 Range: 0 to 0.20 Wt: 0.20 Range: 0 to 0.20 Wt: 0.15 Range: 0 to 0.15 Wt: 0.25 Range: 0 to 0.25
60 Minute Initation (rules with satellite data) Cont. Boundary Collision: Wt: 0.12 Range: 0 to 0.12 Sat_Clear: Wt: 0.40 Range: -0.40 to 0 Lake: Wt: 0.10 Range: -0.10 to 0 Initiation Levels: 0.70 => Init 1 0.90 => Init 2 1.20 => Init 3
Cumulus development Boundary characteristics Satellite Cloud Typing B-L characteristics Storm motion and trends Large-ScaleEnvironment Predictor Fields
Cumulus development Boundary characteristics Satellite Cloud Typing B-L characteristics Storm motion and trends Large-ScaleEnvironment Predictor Fields
Why do we need a forecaster in the loop?? • Forecasters see the larger picture • Conceptual Models • Ignore bad data points • Understand limitations of NWP and observations
Forecaster Entered Boundary FAA RCWF Domain June 12, 2003
Draw Tool Entering a convergence boundary in real time is as simple as this demonstration!
Where has the Auto-nowcaster been demonstrated ? • Weather Forecast Office Washington DC (Sterling, VA) • Sydney Australia Forecast Office • U. S. Army White Sands Missile Range • Central U. S. for the FAA Process of being transferred to: • Bureau Meteorology Beijing China • U.S National Weather Service – Dallas/Fort Worth Weather Forecast Office • AWIPS
Auto-Nowcaster at Ft. Worth WFO05 April 2005 On this day, dryline was moving in from the west. Below is an example of one of the Area Weather Updates that they put out on that day: AREA WEATHER UPDATE NATIONAL WEATHER SERVICE FORT WORTH TX 310 PM CDT SUN APR 10 2005 > WARNING DECISION UPDATE FOR NORTH TEXAS MESOANALYSIS PROGRAMS SHOW 1000-1500 J/KG CAPE ALONG AND JUST AHEAD OF DRYLINE. THUS...CU/DEVELOPING STORMS ALONG/E OF DRYLINE SHOULD CONTINUE TO INTENSIFY. STORM INITIATION TOOL ALSO SUGGESTS HIGH POSSIBILITY OF DEVELOPMENTFARTHER SW...OVER CORYELL/LAMPASAS COUNTY AREA. DEEP-LAYER SHEAR MORE THAN SUFFICIENT FOR ORGANIZED STORMS AND AT LEAST MID-LEVEL MESOS. AS STORMS EVOLVE INTO THE EVENING...A MORE LINEAR MODE IS EXPECTED.
Ft. Worth WFO 05 April 2005 Forecast: 2003 Z Radar Image: 2003 Z Forecast: 2003 Z Radar Image: 2108 Z
Ft. Worth WFO 05 April 2005 Forecast: 2044 Z Radar Image: 2044 Z Forecast: 2044 Z Radar Image: 2142 Z
Ft. Worth WFO 25 April 2005 • On this day there was a dryline moving in from the west. • Storms developed a couple of hours earlier than originally thought. • The ANC system captured the initiation of this event with about a 40-50 minute lead time. • The storms went severe within 30 minutes of initiation (about 50 miles west of DFW Metroplex) with quarter sized hail, strong winds and several mesocyclones.
Ft. Worth WFO 25 April 2005 Forecast: 1831 Z Radar Image: 1831 Z Forecast: 1831 Z Radar Image: 1929 Z
Ft. Worth WFO 25 April 2005 Forecast: 1842 Z Radar Image: 1842 Z Forecast: 1842 Z Radar Image: 1941 Z
Ft. Worth WFO 25 April 2005 Forecast: 1854 Z Radar Image: 1854 Z Forecast: 1854 Z Radar Image: 1952 Z
Ft. Worth WFO 25 April 2005 Forecast: 1905 Z Radar Image: 1905 Z Forecast: 1905 Z Radar Image: 2003 Z
Ft. Worth WFO 25 April 2005 Forecast: 1917 Z Radar Image: 1917 Z Forecast: 1917 Z Radar Image: 2020 Z
Ft. Worth WFO 25 April 2005 Forecast: 1929 Z Radar Image: 1934 Z Forecast: 1929 Z Radar Image: 2030 Z
Ft. Worth WFO 25 April 2005 Forecast: 1941 Z Radar Image: 1940 Z Forecast: 1941 Z Radar Image: 2042 Z
Ft. Worth WFO 25 April 2005 Forecast: 1952 Z Radar Image: 1951 Z Forecast: 1952 Z Radar Image: 2054 Z
Ft. Worth WFO 25 April 2005 Forecast: 2003 Z Radar Image: 2003 Z Forecast: 2003 Z Radar Image: 2107 Z
Ft. Worth WFO 25 April 2005 Forecast: 2020 Z Radar Image: 2020 Z Forecast: 2020 Z Radar Image: 2119 Z
Ft. Worth WFO 25 April 2005 Forecast: 2030 Z Radar Image: 2030 Z Forecast: 2030 Z Radar Image: 2129 Z
Ft. Worth WFO 25 April 2005 Forecast: 2042 Z Radar Image: 2042 Z Forecast: 2042 Z Radar Image: 2142 Z
Ft. Worth WFO 25 April 2005 • This was one of the first events after some modifications had been made to the system based on forecaster feedback (i.e. a CIN predictor field was added to the forecast logic). • Had this information not been included, the ANC system would have produced several hours of false alarms prior to storms initiating. • Several forecasters consulted the system during this event and it was used to help with spotter activation.
Our Impressions of the Ft. Worth WFO Deployment • Users have been very accommodating of new technology. • Users have done a really good job of entering boundaries. • Use the system most often early on in the convective events during initiation/development phase. • Received a lot of very useful feedback from the users. • Have incorporated some of the forecasters ideas which we feel have led to improved forecasts and are in the process of implementing others.