Download

1 / 43
430 likes | 499 Views
Remotely Troubleshooting Embedded Systems using High Quality Log Files. ESC 313. 3/28/2012. Dave Stewart, PhD Director of Software Engineering InHand Electronics dstewart@inhand.com www.inhand.com. Objective.

E N D
Remotely Troubleshooting Embedded Systems using High Quality Log Files ESC 313 3/28/2012 Dave Stewart, PhD Director of Software Engineering InHand Electronics dstewart@inhand.comwww.inhand.com
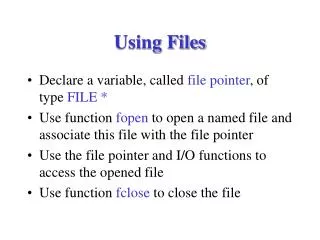
Objective • If a deployed system fails, have sufficient data captured to identify root cause and find a fix, without having to replicate the issue • Necessary for embedded systems that behave differently in the field than in the lab • Essential in critical failures where replicating the issue is impossible • Eliminate lengthy debug cycles that result when failures are observed but little data is available to understand the issues
Primary Goals • Improve quality of log files • Standardize format for every module that logs data • Ensure consistent and complete information • It only takes one missing piece of information to make it impossible to pinpoint a root cause from a log file. • Standardize process • Determining log info should be a design step • Don’t rely on programmers to add in debug info on-the-fly; such ad-hoc methods lead to poor-quality log files.
Key Aspects • Text Logs • Capture system configuration and boot-time information • Print version numbers of every module • Binary Logs • Continually collect data about a running system • Manage limited non-volatile memory and performance • Parser • Back at the lab, automatically convert binary logs to text • Visualize data trends to spot anomalies
Text Logs of Boot and Initialization • Most OS already provide a mechanism for printing at boot-up • However, inconsistency in the design of kernel initialization code or driver code often means only partial information is printed, and not necessarily the most important information • In this class, focus on WHAT to capture, not HOW • Use the OS mechanism • Augment with macros to standardize • Make sure key information is printed • Avoid printing wasteful info, so that boot time does not slow down due to logging
Issues with Typical Boot Logs • Typical Log Entry fprintf(logfile,“SPI Driver Init”); • Information that should be printed, but is missing: • Which SPI port? • How is it being configured? • Which pins is it using? • How is the control register initialized? • Did the right version get built and integrated? • Can the right source code be found quickly?
Use Macros to Auto-Generate Info • #define LOG_ENTER() \ fprintf(logfile,“[%s/%d %s] %s %s %d\n”, \ __FILE__,__LINE__,__FUNCTION__,\ __DATE__,__TIME__,getpid()) • Which produces and entry similar to the following in the log [file.c/87 xxx_init] Feb 20 2012 11:33:07 8880 • Simply place LOG_ENTER() as first line in every driver or module initialization function • Information such as filename, line, and date help identify exactly which module was loaded. • PID helps link thread IDs to functions, which could become useful when debugging and PID of failed thread is available. • Version is especially important if customers have ability to download patches or updates, to know precise state of the code.
Print Key Configuration Information • When a module or driver is initialized, print value of every configurable item • If there is data that could be changed on an individual platform, like in a registry of configuration file, then that information may be useful in remotely debugging an issue • Be concise and complete • Print statements slow down boot process, so don’t be verbose. Just print values with minimal information that allows correlating back to source code
Example of Printing Key Information • Too verbose, not enough info SPI driver initialized in master mode, Port 2 Speed set to 20 Mbps Framesize 16 bytes Clock on GPIO 12, Frame on GPIO 11 MOSI on GPIO 13, MISO on GPIO 14 • More concise, yet more detail (i.e. +filename/line): [spi.c/64] SPI_2M 20Mbps fs=16 GPIO={12,11,13,14}
Print Thread and Interrupt Information • Info is needed when parsing a run-time log • Allows correlating a thread or interrupt ID back to the source code. • To the extent possible, print an entry each time a thread is created and terminated • It should include Thread ID, function name, time stamp, and any information to distinguish it if multiple threads of same function are created • This is not always practical • A thread that is created and destroyed repeatedly needs to be skipped • In this case, consider it run-time information as described later • Similarly, print information for each interrupt handler that is initialized
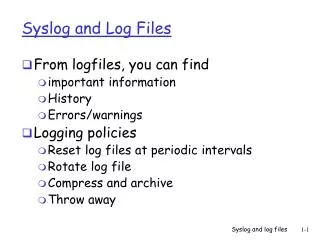
Run-Time Log Files • Continuously collect data on every aspect of the system • Budget the amount of space needed to store log files early during system design • Decide what percentage of CPU time can be allocated for this function. • 2% to 5% overhead is reasonable. • Store data in non-volatile memory • E.g. flash, SD card, or SSD drive • For retrieval either by opening unit, or through an existing customer communications link • Do not store any classified data in the log files! • Important in military or other classified system
High Quality Log Files • “High Quality” means all required data to debug an issue has been captured • It eliminates reliance on imprecise customer descriptions of the problem or what led to the problem. • Avoids the need to have to replicate the issue to debug it • Replicating an issue is simply a means to collect more clues. • In some critical systems this is absolutely essential • E.g. the Airplane “Black Box”
High Quality Log Files • Provides the data needed to re-run in simulation • If debugging using traditional means is necessary to identify root cause, a high quality log file provides the data needed to re-run in simulation • Carefully review every detail that goes into the log • A log file contains poor information if it only provides minimal or partial clues to the actual problem
Concise Log Files • Memory reserved for log files can fill up quick • Optimize memory usage as part of the design. • Be cryptic to save memory • Cryptic is fine as long as there is easy way to decipher the log file. • For example: “Average of velocity for past 30 seconds = 3.49231” • uses 40 bytes of memory “av30=3.49231” • uses 12 bytes of memory • Both the above provide equal amount of information, but second one is more concise, and log is searchable by unique acronym “av30”
Concise Log Files • Even more concise, store in binary: 0xaa30 0x405F8202 • Uses 6 bytes of memory • 16-bit number as a key allows for 65536 separate types of log entries • 32-bit floating point number is only 4 bytes of data • Create code or scripts to parse data, and quickly search or filter desired data • Example provided later
What Information Must be Logged? • Every key item needed to “replay” what happened • Next few slides define what are those key items • Periodic Timestamps • Microsecond resolution is desirable. • Millisecond resolution is essential. • Relative time, stored as a 16-bit or 32-bit number is often acceptable • Don’t use more than 4 bytes per timestamp, or memory will fill up too quickly. • Time-of-day • If time-of-day is available, periodically log it.
Logging Key Items: System State • Periodically log the “state” of the system, including the following: • The “mode” or “state” for any code that is built as a finite state machine • The current value and setting of every GPIO pin • Current value of every key peripheral register • Current value of key global variables • Current value of sensor readings • Current value of any controller output
Logging Key Items: Communication • Summary of every communication message that is sent or received: • Includes Ethernet, WiFi, USB, SPI, etc. • Save key information, such as sender or receiver, size of message, command or message type. • For short messages (i.e. a few bytes) include entire message. • For longer messages, include first few data bytes
Logging Key Items: I/O • Every driver output • E.g. Instrument the stream interface, so that every writeoperation is captured • Save device, port, and value written • Inputs or reads • If state changes made based on an input, then log that input • If inputs are stored as part of the periodic state that is logged, then no need to separately log the input • Every configuration change • If a key device configuration register is changed, then log the new value written
Logging Key Items: Interrupts • Every Interrupt • Timestamp of entry into andexitfrom ISR • IRQ number on entry • If this is a shared IRQ, which device was interrupting • Memory Optimization • For interrupts that occur very frequently (such as timer interrupt), skip the timestamp and use just codes, e.g. 2 bytes on entry, 2 on exit, to not fill up log memory
Logging Key Items: Context Switches • Every Context Switch • Timestamp of entry into each thread • Thread ID • Timestamp of any entry into idle state or thread • Instrument the OS • The line of code to log this event needs to be in the operating system scheduler, right before the context switch occurs • Some OS already provide hooks at this specific spot
Completeness of Logs • Avoid Gaps • Log files are most effective when there are no “gaps” in information • This happens when one or more modules do not log like they should • Put code to log information into kernel code • E.g. in drivers or operating system functions, where they cannot be touched or changed by applications • Logging is then enabled always for everything • Do not provide an ability to disable it. • Software can be certified with logging enabled, as long as the logging threads are part of the design documents
Wow! Isn’t that way too much to log? • A lot of data, but not TOO much • Sample calculation next slide • Size of flash storage needed proportional to complexity of the embedded system • For smaller systems, memory may only need to be measured in KB or MB • For more complex architectures, may need GB • Not free, but usually affordable • For smaller sizes, external EEPROM for under $1 • Leverage the fact that external flash can be obtained for under $1 per GB in bulk
Example – High Performance System • Typical of 32-bit ARM with RTOS • State of system, 400 bytes, once per second • Messages, 16 bytes per message, 500 messages per second • I/O Driver Writes, 12 bytes per call, 200 times per second • Interrupts, 12 bytes per interrupt, about 800 times per second • Context Switches, 8 bytes per switch, 200 times per second • Above scenario = 400+12*800+12*200+8*200+16*500 = 22 kBytes per second= 1.3 Mbytes per minute= 80 Mbytes per hour= 2 GBytes per day, assuming 100% 24/7 usage
Example – Low-End System • Typical of an 8-bit system with only a few kbytes of RAM • State of system, 30 bytes, every 10 seconds • Messages, 4 bytes per message, 1 message per second • I/O Driver Writes, 12 bytes per call, 10 times per second • Interrupts, 4 bytes per interrupt, about 10 times per second • Context Switches, 4 bytes per switch, 5 times per second • Above scenario = 3+4+12*10+4*10+4*5 = 187 bytes per second= 11 kBytesper minute= 673 kBytesper hour= 16 MBytesper day, assuming 100% 24/7 usage
Optimizing Memory Usage • Take into account use-cases • Many embedded systems only used a few hours per day • Detect when system is idle or is in a steady state • Have a code to indicate idle or “same as previous entry” • Use a circular buffer in the flash • Discard oldest data. Usually only last few minutes to hours of a log are needed Based on above, actual requirements could be just a fraction of what was computed on prior slides
Managing Log Files • Store multiple small files instead of one big file. • E.g. start a new file every 5 minutes. • Makes it easier to retrieve only partial logs within specific time periods. • Use a DRAM FIFO • Most logging is done in kernel space, where file access is not available • Write to DRAM FIFO, overhead is negligible. • Periodically, have a high-priority thread read a large block of data from FIFO and write it to log file.
Performance of Logging • Execution time to save log is minimal • With proper optimization of log code, the logged data should not use more then 2 to 5% of the processing power. • E.g. Can write SD at 1MByte/sec, 2% overhead means maximum 22KByte/sec. • “5% overhead is too much” • Only an issue on systems that are almost overloaded • Consider the cost of NOT having this data when a problem occurs in a field unit that needs to be fixed. • Trade-offs: the 5% overhead may be more valuable than another thread that uses more than that much CPU power
Verifying Log before Deployment • Test the mechanism • Have QA team inject a fault • Run the systemthat captures the log • Can the software team find the problem given just the log? • Optimizing dominating log statements • If log file fills up with one piece of non-critical information because it executes very often, optimize the number of bytes needed, or reduce how often it gets logged • Boot system with and without log enabled • How much longer was boot time with logs enabled? • Rule of thumb, it should not be more than about 10% longer
Parsing a Log File • Create code or scripts • This can’t be a manual process • Convert binary log file to text • Example of a flexible mechanism on next slide • Add filter capabilities • Include or exclude selected codes based on issue being debugged • Add analysis functions • Extra data values for certain codes and graph them • Find minimum or maximum values for certain variables
Example • Next few slides show sample code: • Log format • Log macros • FIFO stream or Buffered I/O • Define codes for each log item • Instrument sources • Dump-to-file thread • Run code to produce log file • Parser • Filter
Log Format • Create multiple data structures for each different data size. E.g. // Example Log Format 1 typedefstruct { uint16_t code; uint16_t value; // for both 8-bit and 16-bit } log_1_t; // Example Log Format 2 typedefstruct { uint16_t code; uint16_t tstamp; uint32_t value; // for 32-bit values } log_2_t;
FIFO Stream • Use a FIFO stream to write to file • FIFO needed if logging is in kernel space, but writing to file done from application space • Buffered I/O appears to provide same function, but it doesn’t! It does the writes in kernel space and as part of the process calling the log function, which could affect real-time performance! • Use real-time scheduling analysis to determine correct priority of thread writing to file. • Write a few bytes at a time to log area in memory • Structures should be kept 32-bit word aligned to minimize overhead • Write to file when log area exceeds a threshold • E.g. when file system block size is reached • Or “every 16 blocks” • Trade-off – don’t wait too long, because if there is a hard crash, anything in RAM not on disk is lost.
Log Macros #define LOG_ENTRY_1(_code,_val) { \ log_1_t l; \ l.code = _code; \ l.value=(uint16_t)_val; \ fifo_insert(&fifo,(uint8_t *)&l,sizeof(l));} #define LOG_ENTRY_2(_code,_val) { \ log_2_t l; \ l.code = _code; \ l.value=(uint16_t)_val; \ l.tstamp = (clock() ); \ fifo_insert(&fifo,(uint8_t *)&l,sizeof(l));} #define LOG_SYNC() LOG_ENTRY_2(CODE_SYNC,CODE_SVAL)
Define Codes for Each Log Item #define CODE_I 1 #define CODE_X 2 #define CODE_Y 3 // SYNC Code used to insert framing // and to recover in case of corruption #define CODE_SYNC 0xCAFE #define CODE_SVAL 0xBEEF1234
Instrument Sources • Snippet of instrumented code. • After values change, log them. x = x+i; y = y*x; LOG_SYNC(); LOG_ENTRY_1(CODE_I,i); LOG_ENTRY_1(CODE_X,x); LOG_ENTRY_2(CODE_Y,y);
Dump to File Thread • Periodically when buffer exceeds threshold, write to file while(1) { fifo_wait(); fifo_getremove(&cfifo,block,BLOCK_SIZE); fwrite(block,BLOCK_SIZE,1,fp); fifo_remove(&cfifo,block,BLOCK_SIZE); } • Two options for waking up this thread: • Polling: If data collected pretty regularly, then predict when to wakeup. • Signaling: design fifo_insert() to generate a signal when threshold for writing to file is reached. fifo_wait() waits for that signal. • Use In-place fifo_remove • That is, fifo_getremove() retrieves pointer, doesn’t actually copy data. • fifo_remove() only adjusts the pointers to show ‘done’.
Run code to produce log file • File produced is binary. Here is sample hexdump: 000000 fe ca b2 00 34 12 00 00 01 00 00 00 02 00 10 00 000010 03 00 64 01 30 03 00 00 fe ca 16 02 34 12 00 00 000020 01 00 01 00 02 00 11 00 03 00 c8 02 30 36 00 00 000030 fe ca 7a 03 34 12 00 00 01 00 02 00 02 00 13 00 000040 03 00 2c 04 90 05 00 00 fe ca de 04 34 12 00 00 000050 01 00 03 00 02 00 16 00 03 00 90 05 60 7a 00 00 000060 fe ca 42 06 34 12 00 00 01 00 04 00 02 00 1a 00 000070 03 00 f4 06 c0 6d 00 00 fe ca a6 07 34 12 00 00 000080 01 00 05 00 02 00 1f 00 03 00 58 08 40 4a 00 00 000090 fe ca 0a 09 34 12 00 00 01 00 06 00 02 00 25 00 • Sync Pulses shown in yellow • Allows validating that log file not corrupted • Easily identify start of a cycle • Use to “fast forward” through a log file, since each one has a relative time-stamp on it
Parser – Setup • Define a look-up table • Print format for each type of log entry is provided in table • E.g.: typedefstruct { int code; int type; char *fmtstr; } log_entry_t; log_entry_t table[] = { {CODE_SYNC, 2, "Sync Pulse @ %d\n"}, {CODE_I, 1, "i= 0x%02X\n"}, {CODE_X, 1, "x= 0x%02X\n"}, {CODE_Y, 2, "y= 0x%04X @ %d\n"}, };
Parser – Code • On PC, run through entire log file • Convert binary to ASCII text • E.g. p = &buffer[0]; while (!eof) { code = *(uint16_t *)p; idx= find_idx(code); switch (table[idx].type) { case 1: { log_1_t*l = (log_1_t *)p; printf(table[idx].fmtstr,l->value); p += sizeof(log_1_t); } break; case 2: { log_2_t*l = (log_2_t *)p; printf(table[idx].fmtstr,l->value,l->tstamp); p += sizeof(log_2_t); } break; } }
Sample Output from Parser Sync Pulse @ 348 i = 0x00 x = 0x10 y = 0x0330 @ 356 Sync Pulse @ 704 i = 0x01 x = 0x11 y = 0x3630 @ 712 Sync Pulse @ 1062 i = 0x02 x = 0x13 y = 0x0590 @ 1068 Sync Pulse @ 1418 i = 0x03 x = 0x16 y = 0x7A60 @ 1424
Filter as Needed • Use scripts or code. • Simplest example is to look at just one value: prompt> ./parse logfile.bin| grep "x=" x= 0x10 x= 0x11 x= 0x13 x= 0x16 x= 0x1A x= 0x1F • Can also create parser to generate data in a form that can be graphed • Enables viewing trends, such as for control system variables, number of events, etc.
Summary • Objectives: • If a deployed system fails, have sufficient data captured to identify root cause and find a fix, without having to replicate the issue • Primary Goals • Improve quality of log files • Ensure consistent and complete information • Define a company-wide process • Techniques • Text logs for boot-up • Binary logs for run-time