Download
1 / 20
200 likes | 283 Views
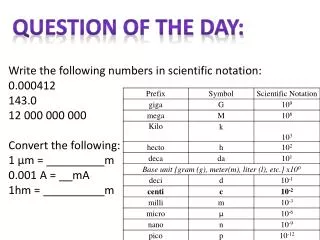
Question of the Day. Question: Who is your new desk partner and what do they like to do for fun? Answer: … … …. Hang onto your labs! Nothing to turn in yet!. Biosphere Observations. p. 145 A.Q. 1ab, 2ac . 1a. Describe the general trend of human population growth over time.

E N D
Question of the Day Question: Who is your new desk partner and what do they like to do for fun? Answer: … … … Hang onto your labs! Nothing to turn in yet!
p. 145 A.Q. 1ab, 2ac 1a. Describe the general trend of human population growth over time. 1a. The general trend of human population growth over time is that for tens of thousands of years, the human population grew very slowly. Then, about 500 years ago, the population started to grow exponentially and increased dramatically. The growth rate slowed in the second half of the twentieth century; the population is still growing, but at a slower rate. 1b. What factors contributed to the pattern of growth shown in figure 5-11? 1b. Factors that contributed to the pattern of growth shown include harsh living conditions that resulted in high death rates that occurred through most of human history. Rapid population growth occurred when advances, such as improved nutrition, healthcare, and sanitation, decreased the death rate.
p. 145 A.Q. 1ab, 2ac 2a. Why do populations in different countries grow at different rates? 2a. Populations in different countries grow at different rates because they have different birthrates, death rates, and age structures. 2c. Are age-structured diagrams useful in predicting future population trends? 2c. Your answer here!
p. 141 A.Q. 1ab, 2b, 4 1a. What is a limiting factor? 1a. A limiting factor is a factor that controls the growth of a population. 1b. How do limiting factors affect the growth of populations? 1b. Limiting factors affect the growth of populations by determining the carrying capacity of environments for populations. 2b. What is the relationship between competition and population size? 2b. The relationship between competition and population size is that competition between individuals increases as population size increases. • Study the factors that limit population growth in figure 5-6. Classify each factor as biotic or abiotic. 4. Biotic factors in the figure include competition, predation, parasitism, and disease. Unusual weather and natural disasters are abiotic factors.
p. 148 #9, 10, 13, 15 9. What is carrying capacity? Give an example. 9. Carrying capacity is the maximum number of individuals of a particular species a particular environment can support. One is example is how many reindeer can live on St. Paul Island continuously. 10. How is the carrying capacity of a city’s roads similar to the carrying capacity of an ecosystem? • The carrying capacity of a city’s roads and the carrying capacity of an ecosystem are similar because they are both limited by the resources available. In the case of a city’s roads, the carrying capacity depends on factors such as the number and width of roads and the number of intersections. In an ecosystem, the carrying capacity depends on factors such as the amount of space and food.
p. 148 #9, 10, 13, 15 13. How might increasing the amount of a limiting nutrient in a pond affect the carrying capacity of the pond? 13. Increasing the availability of a limiting nutrient would increase the carrying capacity of the pond. 15. Describe how a predator-prey relationship can control both the predator population and the prey population. 15. A predator-prey relationship can be a mechanism of population control for both species. The population size of predators is limited by the number of prey available to eat. In turn, the number of prey is limited by the predation.
Types of Growth Exponential: Unrestricted Growth Examples? Logistic: Restricted Growth Examples? S-shaped curve J-shaped curve
Types of Populations Open: Emigration & Immigration Can Occur Examples? Closed: No Emigration & Immigration Examples?
Before Quiz: • Complete Scantron info; subject = Populations • During Quiz: • Test dividers up until everyone is done • May use reindeer (2.2), yeast (2.1), and vocab sheet • Don’t write on quiz • After Quiz: • Turn in quizzes IN ORDER up front (1’s go on top) • Turn in 2.2 & 2.1 • Leave dividers up • Productive time: work on unit 2 vocab sheet • NO ELECTRONICS!
Unit 2 Vocabulary • Rate (of growth)- how fast a population increases or decreases in size during a given time period; expressed as a percentage
Unit 2 Vocabulary • Rate (of growth)- how fast a population increases or decreases in size during a given time period; expressed as a percentage 10. Human population growth- how our population size is increasing rapidly
Unit 2 Vocabulary • Food calorie (kilocalorie)- a measure of the energy stored in food; actually 1000 calories in terms of chemistry
Unit 2 Vocabulary • Malnourished- affected by improper nutrition; missing key nutrients, variety in diet • Undernourished- having insufficient food
Unit 2 Vocabulary • Pyramid of numbers- shows the relative number of individual organisms at each trophic level in an ecosystem 31. Pyramid of mass (pyramid of biomass)- shows the relative amount of matter contained within each trophic level
Unit 2 Vocabulary 32. Pyramid of energy- shows the relative amount of energy contained within each trophic level 33. 10% rule- only 10% of energy is transferred from one trophic level to another; the rest is lost, especially as heat
Unit 2 Vocabulary • Primary productivity- a measure of the synthesis of compounds like sugar; usually happens through photosynthesis • Gross primary productivity- how much chemical energy producers create in a given amount of time
Unit 2 Vocabulary • Primary productivity- a measure of the synthesis of compounds like sugar; usually happens through photosynthesis • Gross primary productivity- how much chemical energy producers create in a given amount of time • Net primary productivity- how much chemical energy producers create after subtracting what chemical energy the producers use themselves