Download
1 / 29
300 likes | 410 Views
Milan Conference Monte Carlo, November 7, 2002. Managing IT in a Turbulent Economy. Milan Conference Monte Carlo, November 7, 2002. Living in a world of 10-sigma events. The IT productivity puzzle. Managing IT through the downturn. Managing IT in a Turbulent Economy. Milan Conference

E N D
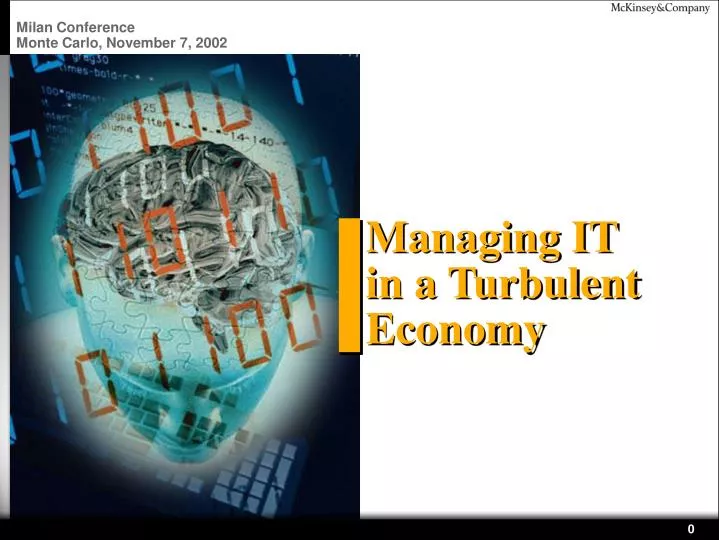
Milan Conference Monte Carlo, November 7, 2002 Managing IT in a Turbulent Economy
Milan Conference Monte Carlo, November 7, 2002 Living in a world of 10-sigma events The IT productivity puzzle Managing IT through the downturn Managing IT in a Turbulent Economy
Milan Conference Monte Carlo, November 7, 2002 Living in a world of 10-sigma events The IT productivity puzzle Managing IT through the downturn Managing IT in a Turbulent Economy
Historic asset price deflations: (not quite) 10-sigma events Percent • Mississippi • company • scam 1716 - 20 • Tulip bubble • 17th century • Great • depression • NASDAQ • composite • Telecom • index** • Neuer Markt* • - 78 • - 79 • -89 • - 95 • - 96 • -99 * Nemax All Share ** MSCI World Telecommunication 021107FTmd_ZXT_764 (Milan Conference).ppt
Tremendous second order effects GAP BETWEEN TRS* AND 10-YEAR T-BILL, percentage points Investment Company Act (1941) Sherman Anti- Trust Act (1912) Glass-Steagall Act (1933) Gramm-Leach- Bliley Act (1999) End of fixed commissions (1975) Securities Exchange Act (1934) Sarbanes- Oxley Act(2002) Federal Reserve Act (1913) * 7-year rolling average Source: Internet; DRI; Compustat; McKinsey analysis 021107FTmd_ZXT_764 (Milan Conference).ppt
After 10 years of substantial growth rates IT spending is stalling in 2001 and 2002 IT* SPENDING GROWTH RATE Percent • 1988 • 89 • 90 • 91 • 92 • 93 • 94 • 95 • 96 • 97 • 98 • 99 • 2000 • 01 • 2002 * IT investments including computer hardware & peripherals, software and communication component Source: BEA, Gartner, McKinsey analysis 021107FTmd_ZXT_764 (Milan Conference).ppt
90% of all companies plan to freeze or reduce IT investments in 2003 IT INVESTMENT FORECAST Percent of companies • Higher • Same • Lower • 2001 for 2002 • 2002 for 2003 Source: Meta Group, Computerwoche 40/2002; 236 companies surveyed 021107FTmd_ZXT_764 (Milan Conference).ppt
Yet IT continues to be a strategic success factor • High • Telecom • IT • Banking • Logistics • Annual IT spendingPercent of revenue • 4% • Manufacturing • Healthservices • Education • Utilities • Retailing • Mining • Construction • Low • Low • High • Relevance of IT as strategic success factor Source: Gartner Group IT spend survey, 2001; Meta Group; McKinsey analysis 021107FTmd_ZXT_764 (Milan Conference).ppt
There are still more than 100 companies in the world that spend more than EUR 1 billion on IT • Banking & Securities • Insurance & • Asset Gathering • Telecommunications • High Tech • Automotive/Assembly • Retailing/ • packaged goods • Chemicals/petroleum • Electric Power/gas • Pharma • Travel & Logistics 021107FTmd_ZXT_764 (Milan Conference).ppt
Milan Conference Monte Carlo, November 7, 2002 Living in a world of 10-sigma events The IT productivity puzzle Managing IT through the downturn Managing IT in a Turbulent Economy
Robert Solow: "You can see the computer age everywhere,but not in the productivity statistics" • Percent • IT investment as percent of total business investment • Annual growth in labor productivity 1947 - 1972 1972 - 1995 1995 -2000 1947 - 1972 1972 - 1995 1995 -2000 Source: BLS; BEA; McKinsey Global Institute 021107FTmd_ZXT_764 (Milan Conference).ppt
Only a few industries used IT investment effectively • US GROWTH RATES • Percentage points 20 Securities Computermanufacturing Trans- portation services 10 Labor productivity growth rate 1987 - 1995 vs. 1995 - 1999 (CAGR) Air transportation 0 Retail banking Railroad transportation Trucking and warehousing -10 -15 -15 -10 0 10 20 30 IT investment growth rate 1987 - 1995 vs.1995 - 1999 (CAGR) Source: BEA; MGI analysis, McKinsey Global Institute 021107FTmd_ZXT_764 (Milan Conference).ppt
Why did IT investments often fail to deliver productivity improvements? 1 • Exuberant overinvestment in IT during tech bubble 2 • Unclear business vision and missing alignment with IT capabilities 3 • Limited ownership of IT investments by business executives 4 • Many IT investments targeted atback office, not at customer benefit 5 • Insufficient business process improvement prior to IT introduction 6 • Multiple problems, delays, and failures in IT mega project management 7 • Intrinsic growth of IT complexity Source: McKinsey 021107FTmd_ZXT_764 (Milan Conference).ppt
Milan Conference Monte Carlo, November 7, 2002 Living in a world of 10-sigma events The IT productivity puzzle Managing IT through the downturn Managing IT in a Turbulent Economy
Key factors for managing IT through the downturn 1 • Clear business direction • Redesignyour business system • Focus IT investments on renewing the business system 2 3 • Develop IT architecture and road map • Charting the course for transformation • Design and execute high quality IT management processes • Be a fast follower on technology innovation 4 • Source smartlyto protect strategic IT assets and capabilities 5 6 • Rigor and discipline • in execution Source: McKinsey 021107FTmd_ZXT_764 (Milan Conference).ppt
Redesign your business system first HIGH TECH COMPANY EXAMPLE • The threat ... • Poor supply chain performance harmed revenues • Fundamental improvement of supply chain required • Lead time reduction by 40% • Late deliveries reduction from 50 to 5% • Cost of sales reduction by 30% • Inventory days reduction from 130 to 60 • Change supply chain from multi-channel, multi-location to direct order/delivery • One uniform global supply chain interlinked with customers • One direct ordering/delivery process • One integrated IT platform Source: McKinsey 021107FTmd_ZXT_764 (Milan Conference).ppt
Ordering systems • Production systems Redesigning the business system was precondition for simplified, value-adding IT support HIGH TECH COMPANY EXAMPLE Customer Local sales Business group Manufacturing • Historically grown business segmentation led to system diversity,complex hand-overs, and low transparency • SAP R/3 • Supply • Finance • Production systems • Sales systems Customer database • Product • database • Tracking and tracing • Value-adding IT integration of customers feasible only due to pro-cess simplifi-cations • SAP R/3 • Supply • Finance • Shared ordering solution • Sellingchain Global datastore customer, products • Supply planning tool Source: McKinsey 021107FTmd_ZXT_764 (Milan Conference).ppt
Supply chain redesign and IT enabling achieved the desired results HIGH TECH COMPANY EXAMPLE Customer Local sales Business group Manufacturing • Historically growth busi-ness segmen-tation led to system di-versity, and complex hand-overs and low transparency • SAP R/3 • Supply • Finance • Production systems • Ordering system • Sales system • Significant improvements achieved within two years Customer database • Product • database • Lead time: -32% • Late deliveries: -72% • Cost of sales: -38% • Inventory days: -40% • Personnel: -22% • Tracking and Tracing • Value-adding IT integration of customers feasible only due to pro-cess simplifi-cation • SAP R/3 • Supply • Finance • Shared ordering solution • Sellingchain • Production systems Global datastore customer, products • Supply planning tool Source: McKinsey 021107FTmd_ZXT_764 (Milan Conference).ppt
"Change • ~ 20 the company" "Run • ~ 80 the company" Focus IT investments on renewing the business system IT PROJECT BUDGET Percent 50 • Budget reallocation from "Run the company" to "Change the company" by • Focusing on target platforms • Retiring redundant applica-tions • Stopping messy projects early • Skipping infrastructure cycles • Establishing clear architecture 50 • Today • Target Source: McKinsey 021107FTmd_ZXT_764 (Milan Conference).ppt
A big bang approach to IT transformation is risky FAILURE PROBABILITY BY PROJECT SIZE Percent • Results • Small projects • 7 • Average cost overrun 89% and time overrun 122%** • Hershey lost revenues of USD 3 bn due to failed ERP project • Medium projects • 20 • Nike share price drops by 20% due to failed global SCM introduction • Large projects • 65 • Failure probability* • Ten-year SBC millennium project stopped due to merger • Siemens HR system introduction stopped after 4 years/USD 60 m * Stopped or majorly delayed projects; small ~ 102 FP, medium 103 - 104 FP, large ~ 105 FP ** Standish group survey of 500 IT projects Source: Software Productivity Research, Inc., McKinsey 021107FTmd_ZXT_764 (Milan Conference).ppt
Paris 1900 Paris 1900 • Roads • Railways Develop IT architecture and road map – city planning Source: McKinsey 021107FTmd_ZXT_764 (Milan Conference).ppt
Paris 2000 Paris 2000 Develop IT architecture and road map – city planning • Stable infrastructure (roads, waterways, metro) • Renovatedbuildings are still standing • Roads, districts, buildings, bridges still have the same names • New houses,hospitals, schools are built Source: McKinsey 021107FTmd_ZXT_764 (Milan Conference).ppt
Paris 2000 Paris 2000 1. A city plan outlines infrastructure and components (e.g., parks, hospitals, airports) • Stable infrastructure (roads, waterways, metro) 2. A connecting infrastructure enables standardized services (e.g., metro, streets) 3. Each project exploits existing assets 4. A central board ensures controlled evolution, but asset ownership is decentral Develop IT architecture and roadmap – city planning • Renovatedbuildings are still standing • Roads, districts, buildings, bridges still have the same names • New houses,hospitals, schools are built Source: McKinsey 021107FTmd_ZXT_764 (Milan Conference).ppt
Peak of hype • Plateau of maturity • Trough of disillusion-ment Be a fast follower on technology innovation • Hype • XML (industry standards) • Web • services • Enterprise application integration • "Strategic" outsourcing • Java • Application servers • XML (corp.standards) • Mobilebroadband • Fixed-linebroadband • Time Source: Gartner Group, McKinsey 021107FTmd_ZXT_764 (Milan Conference).ppt
50% of all companies dissatisfied with outsourcing deals in 2000 CUSTOMER SATISFACTION WITH OUTSOURCING, 2000 Percent of all outsourcing deals • Customers… • would structuredeal differently • dissatisfied withof outsourcing provider • lost money through outsourcing Source: Outsourcing Conference Board on Outsourcing 2000 021107FTmd_ZXT_764 (Milan Conference).ppt
Implementation maintenance/operations Source smartly to protect strategic IT assets and capabilities • Value added Design Management complexity will not change • Design ownership protects business and maximizes value capturing • Define business system and strategic IT capabilities • Establish efficient processes • Design and manage IT architecture and road map • Share valuefrom economies of scale, scope, and skill with IT provider • Leverage best-suited outsourcing model/partner per task • Transformation time line Source: McKinsey 021107FTmd_ZXT_764 (Milan Conference).ppt
Increase executional IT capabilities step by step PROCESS MATURITY LEVELS Level 5 Optimizing Level 4 Managed • Continuous optimization of IT management processes Level 3 Defined • KPIs for all processes defined and controlled Level 2 Repeatable • All IT manage-ment processes well defined, established, and controllable Level 1 Initial • Basic standards and tools used • IT management informal, not controllable • Status of most IT organizations • ProfessionalIT service providers • Required only for mission- critical applications • Most organizations require 12 - 18 months to reach next level Source: SEI, Capers Jones 021107FTmd_ZXT_764 (Milan Conference).ppt
Finding the right balance between effectiveness and efficiency 021107FTmd_ZXT_764 (Milan Conference).ppt