Download
1 / 53
530 likes | 687 Views
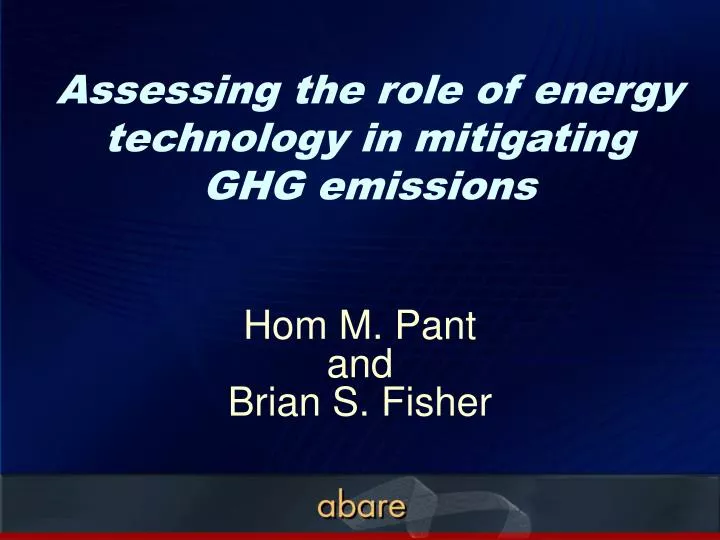
Assessing the role of energy technology in mitigating GHG emissions. Hom M. Pant and Brian S. Fisher. Main objective. Assess the role of zero emission technologies in mitigating global GHG emissions and draw implications to climate change related international agreements and protocols.

E N D
Assessing the role of energy technology in mitigating GHG emissions Hom M. PantandBrian S. Fisher
Main objective • Assess the role of zero emission technologies in mitigating global GHG emissions and draw implications to climate change related international agreements and protocols
The complexity of climate change problem • It is one of the most widely studied and debated topics • It is multi-disciplinary, it is intergenerational, it is transnational and its potential impacts are large • Many scientists now believe that human induced emissions of greenhouse gases (GHGs) are at the root of the climate change problem and the link is nonlinear. • Reduction of GHG emissions is therefore a necessity if we wish to control /eliminate human induced climate change.
How? • Restrict emissions (cap, cap and trade or tax, etc.) • Develop and deploy clean (zero emissions) technologies • A bit of both.
Emissions restriction as such is a complex problem • Need to agree on the level of global emissions as well as its national allocations for each time period. • Enforcement is a global governance problem • Emissions reducing agreements with short term focus, such as Kyoto Protocol, is therefore plagued with various free-rider problems, encourages rent seeking particularly on quota allocation. • ER also restricts the use of energy and transport systems – a lifeline of modern economies. • ER might induce some technological changes, but national as well as international spill over effects keep it below the social optimum.
What sort of international agreement would be desirable? • Self-enforcing (there is no incentive in defecting) • Individually rational (so every country finds it beneficial to join in) and • Environmentally effective (i.e. includes all major emitters, major sources and can hit atmospheric concentration targets by a date)
How does Kyoto fare? Clearly, Kyoto has problems in meeting each of these desirable features. In particular, self-enforceability is probably the most difficult one, each country can benefit by emitting more. Agreeable emissions targets tend to avoid near term abatements (intergenerational free-riding) and induces strategies to shift the abatement tasks onto others (trans-national free riding). Then comes not living up to the commitments (enforceability problem).
Any solutions? • How about taking the second route, develop and deploy zero emissions technology? • Agree on the development and diffusion of clean technologies, initially focussed on energy and transport sector. • Forexample, getpower from renewable sources, such as solar, wind, wave/tide, geothermal and biomass. Use hydrogen as the principal carrier of energy (store and transport)
Any problems? • Yes. It is very expensive compared to fossil fuel technology and may need enormous subsidy and thus economic growth cannot be supported. (Romm, 2004) • However, literature concur on learning by doing effects on costs of new technologies. (Wright, 1936; Arrow, 1962; Grubler and Messner 1998; van der Zwaan et al. 2002; IEA 2000, 2003).
Learning by doing school reports: • For a given concentration target models with LBD imply earlier emissions reductions and lower carbon tax rates (van der Zwaan, et al. 2002) • The impact of a given carbon tax on emission reduction and adoption of carbon-free technology is enhanced significantly with LBD (Gerlagh et al. 2003) • With LBD a tax of $US50/t of carbon is sufficient to stabilise the global emissions at the 2000 level throughout the 21st century (Gerlagh et al. 2004) • Assisting other intermediate form of technologies may be welfare reducing when backstops are subject to LBD. (Kverndokk, Rosendahl and Rutherford 2004)
Are these results general? • These results, however, are based on highly stylised models – 2 energy technologies and combustion is the only source of emissions. • So whether these results stand qualitatively intact in the context of a multi-country, multi-sector general equilibrium model of the global economy with multiple energy technologies and multiple sources of emissions become further questions.
Our Questions: • With LBD, would a sufficiently high elasticity of substitution between a new carbon-free technology and existing technologies be enough to eliminate emissions from the power and transport sectors? Can the ZET dominate in the near term? • Would a reasonably modest carbon tax be enough to stabilise emissions throughout the century as found in the aggregate models? • What else would be necessary to make the world emissions free?
Modifications in GTEMLR • Incorporation of LBD, • Allow high substitution possibility between carbon free of fossil fuel technologies in power generation, • Allow high substitution possibility between all forms of energy and energy carriers in intermediate and final use of energy (add nests) • Introduce increasing costs in extraction of fossil fuels over time (resource exhaustion effects)
(1) • where ; and Modelling increasing cost of fossil fuels
(3) for each input i (4) Where Z is cumulative level of X and B is a constant, and Then the learning lr is given by Modelling LBD in new technologies
Input demand under CRESH: Where and where Modeling VES for multiple power generating technologies Variable CRESH parameter and hence the ES is given by
Calibration of CRESH parameters and ES between hydrogen and existing techs
Modeling energy use by other users • Households: ES = 2 within energy commodity, add one more energy nest • Firms: ES = 2 instead of 0.2 for all fuel commodities. • This still keeps the ES within energy (electric vs. non-electric) group below the literature standard of 3 or more.
region Population Labor supply Fact.neutral productivity OECD90 0.5 0.5 1.5 REF 0.5 0.5 2.0 ASIA 1.0 1.0 2.5 ALM 1.0 1.0 2.5 The base case: assumed annual growth rates of drivers(in percentage change)
The policy scenario • All base case growth shocks plus… • A carbon tax that uniformly increases every year by about 27 cents per ton of carbon until 2050 and remains fixed thereafter • Carbon tax starts in 1998 in OECD90 and REF regions and starts only after 2005 in ASIA and REF. • By 2050 carbon tax attains a value just under $15/tC, a very small tax rate indeed.
Summary and discussions • Our simulation results confirm previous claims • That with LBD and high ES renewables may become dominant energy source and clean hydrogen may become primary energy carrier • That carbon tax may accelerate this transition • That energy and transport sectors may become virtually emissions free • The key to the result, however, is the size of CRESH parameter of the new technology
Should the CRESH parameter be set large enough? • Is an empirical question. As future can not be observed, estimation is not possible. Good ‘guesstimates’ are illuminating. • Higher initial values of ES may reflect • Behavior of very small base quantities • A reflection of possible policy support • It is not uncommon to keep the ES permanently high as the technology matures in which case the results are even better.
Implication to climate policy design • Given the nature of CC problem, the effectiveness of Kyoto-type emissions restricting protocols have been questioned (Fisher et al 2003, 2004; Barrett 2002, 2003; Benedick 2001) • Their criticism was that such protocols lack environmental effectiveness, economic efficiency (self-enforcing) and equity (individual rationality).
The Barrett (2002) proposal • A collaborative effort, incorporated in a new protocol, is needed to fund research into new energy technologies, particularly technologies that produce energy without emitting carbon or that capture and store carbon safely’ • A complimentary pull incentive is also needed... The most attractive approach is to agree on common standards for technologies identified by collective R&D effort. These standards should be established in complimentary protocols. As examples, energy efficiency standards could be established for automobiles, requiring, say, the use of a new hybrid engines or fuel cells. Standards for fossil fuel power plants might require carbon capture and storage.’
Does this proposal satisfy the three principles? Buchner and Carraro (2004) examined the Barrett proposal using FEEM-RICE model and found that • a technology-based agreement would be self-enforcing and individually rational, provided countries who are in get 20% more benefits than free riders from the technological breakthrough.
Evaluating the Barrett proposal… • It was not environmentally effective. The reason was that the R&D that was devoted to development of clean technology not only reduced the emissions intensity of output but also increased productivity of other factors and thus increased the overall output level. The output effect dominated the intensity effects and as a result the protocol was deemed environmentally ineffective.
The Barrett proposal • We argue that the emissions effect found by Buchner and Carraro is due to the inability of the model used to distinguish between development of a clearer technology and factor productivity growth. • In fact, Goulder and Schneider (1999) have found that increased climate related R&D effort might ‘crowd out’ R&D expenditures in the non-energy and carbon based energy sectors hence factor productivity may indeed suffer. • Hence we have no conclusive evidence to reject the Barrett proposal so far.
Global Anthropogenic CH4 Budget by Source in 2000 Total Ag = 52% Total CH4 emissions in 2000 = 1618.4 MtC Source: EPA compilation 2002
Global Anthropogenic N2O Budget by Source in 2000 Total Ag = 87% Total N2O emissions in 2000 = 949.5 MtC Source: EPA compilation 2002
Recommendation: a package of three protocols • That a technology based protocol for global R&D effort complemented by a standards protocol as suggested by Barrett (2002) is an approach worthy of further consideration, • This still leaves the question of dealing with emissions from non-combustion sources which will continue to grow with economic growth, • To address this issue as well as to hasten technology development other instruments, such as carbon tax or extending the scope of R&D and standards protocol to cover other emissions sources, would also need to be considered.
Hydrogen Airplane Design Source: Airbus
Long term technical potential of renewable and nuclear energy supply 2100 Total Energy Demand for SRES scenario ranges 515-2737 EJ/yr Nuclear 77-4620 EJ/yr on average over 100 years
Carbon dioxide storage capacities Emissions to be avoided: 300-1500 GtC up to 2100 Source: Moomaw et al, IPCC, 2001
Contribution to global emissions of the three major greenhouse gases at 1990 Total emissions: 27.9 Gt of CO2e
Contribution to global emissions of the three major greenhouse gases at 1996 Total emissions: 28.7 Gt of CO2e
Contribution to global emissions of the three major greenhouse gases at 2010, reference case Total emissions: 40.2 Gt CO2e