Download
1 / 12
120 likes | 240 Views
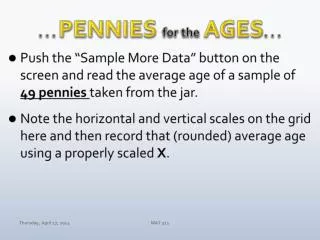
. . . PENNIES for the AGES . . . . Push the “Sample More Data” button on the screen and read the average age of a sample of 16 pennies taken from the jar. Note the horizontal and vertical scales on the grid here and then record that (rounded) average age using a properly scaled X . .

E N D
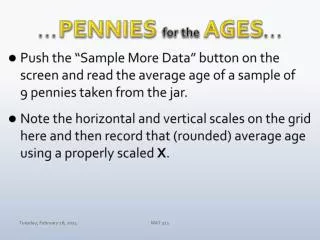
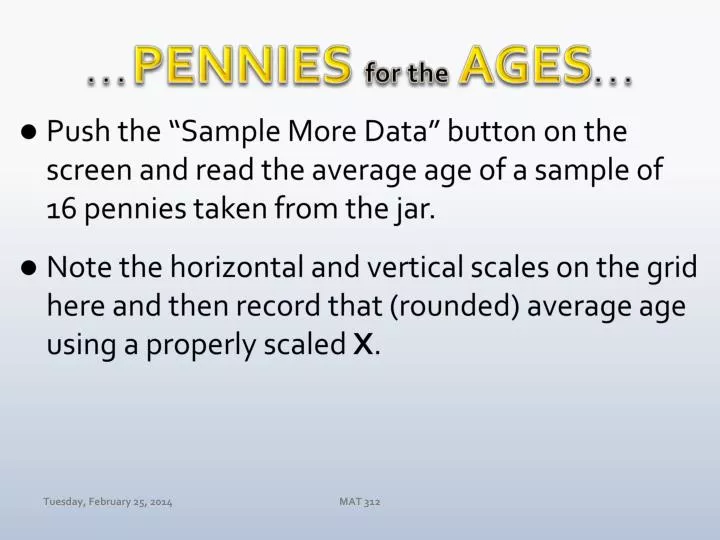
. . . PENNIES for theAGES. . . • Push the “Sample More Data” button on the screen and read the average age of a sample of 16 pennies taken from the jar. • Note the horizontal and vertical scales on the grid here and then record that (rounded) average age using a properly scaled X. MAT 312
Suppose the Kick-a-Poo Milling Company made this claim about their Raisin Bran: In our 20-ounce box of raisin bran, we average 143 raisins per box. Now suppose you just opened a 20-ounce box of Kick-a-Poo Raisin Bran and accurately counted 174 raisins. Would this number of raisins be a rare occurrence? Would it seem unusual to you? Write a sentence to explain your response. MAT 312
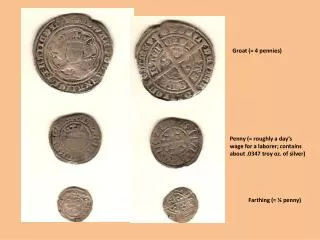
Prob & Stat (MAT 312)Dr. Day Tuesday February 25, 2014 • Grab 16 Pennies at Random then Calculateand Plot Their Average Age • Forming New Small Groups: Random Group Generator • Return to the Raisins Question • In-Class Small-Group Data analysis • Shapes of 1-Variables • 2-Variable Data Sets • Characteristics • Visual and Numerical Representations • Why Explore and Analyze 2-Variable Data Sets? • Assignment for Next Time MAT 312
Raisin-Count Project • Collect Data: Tally the Raising Counts from Snack-Size Boxes of Raisins • Organize the Data: Create Visual and Numerical Representations of the Data • Describe the Distribution: Write a concise paragraph to describe the distribution of the Raisin-Count Data, using the Information generated in the previous Step. • Provide a two-to-three sentence response to this question: • Names of Group Members: MAT 312
Couples’ Ages at Marriage MAT 312
Assignments • Return Test #1 with Comments • Read Chapter 4 • Assignment #4: Scatter Plot of Height vsArm Span MAT 312
Representing Data MAT 312