Download
1 / 43
430 likes | 578 Views
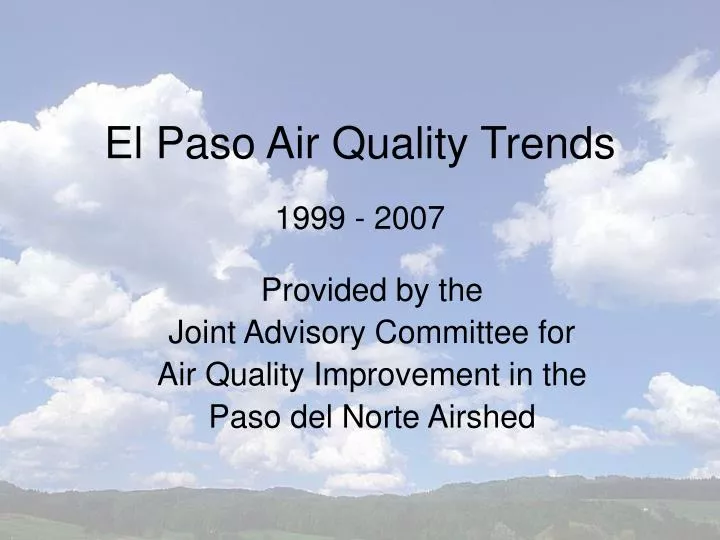
El Paso Air Quality Trends. Provided by the Joint Advisory Committee for Air Quality Improvement in the Paso del Norte Airshed. 1999 - 2007. El Paso & Juarez Area Sites. Emissions Inventories. Summarize air quality emissions by pollutant type and source.

E N D
El Paso Air Quality Trends Provided by the Joint Advisory Committee for Air Quality Improvement in the Paso del Norte Airshed 1999 - 2007
Emissions Inventories Summarize air quality emissions by pollutant type and source
El Paso Area Emissions2005 Emissions Inventory Total NOx: 56 tpd Total VOC: 52 tpd
24-Hour PM 2.5 Design Value 24-Hour PM 2.5 NAAQS* = 35 mg/m3 Data Source: Mark Schmidt, Air Quality and Trend Analysis, US EPA *To exceed the 24-Hour PM 2.5 NAAQS, the design value must be greater than or equal to 36 mg/m3. **The design values were calculated from incomplete data sets and cannot be used to compare to the NAAQS. ***The El Paso Sun Metro site is exempt from the NAAQS and is used here only for trend purposes.
Annual PM 2.5 Design Values Annual PM 2.5 NAAQS* = 15.0 mg/m3 Data Source: Mark Schmidt, Air Quality and Trend Analysis, US EPA *To exceed the Annual PM 2.5 NAAQS, the design value must be greater than or equal to 15.1 mg/m3. **The design values were calculated from incomplete data sets and cannot be used to compare to the NAAQS. ***The El Paso Sun Metro site is exempt from the NAAQS and is used here only for trend purposes.
Data includes natural event days that are not used to determine the design value.
24-Hour PM 10 Design Value 24-Hour PM 10 NAAQS* = 150 mg/m3 Data Source: Mark Schmidt, Air Quality and Trend Analysis, US EPA *To exceed the 24-Hour PM 10 NAAQS, the design value must be greater than or equal to 155 mg/m3. **Design values include natural event days.
Eight-Hour Ozone Design Value Eight-Hour Ozone NAAQS* = 80 ppb Data Source: EPA’s AQS Database *To exceed the Eight-Hour Ozone NAAQS, the design value must be greater than or equal to 85 ppb. **Design Values from 2005-2007 are estimates and are subject to change.
Community Air Toxics Monitoring Network • 5 sites in El Paso (Womble, Ascarate, Chamizal, Sun Metro, UTEP), earliest in 1993, authorized by Legislature. • Some 88 targeted VOC species. • Mission: to determine potential community exposure & long-term health effects, to identify sources of targeted compounds, and to assess trends. • Quality objectives = 95% confidence intervals: • Detection limit (DL) generally < 0.5 ppbV • +/- 25% precision (reproducibility) • +/- 30% accuracy (% difference to standard) • 75% minimum data return per quarter
PAH Sampling Network • PAH = Polynuclear Aromatic Hydrocarbon, large ring aromatic hydrocarbons. Exist in urban air in gaseous or aerosol phase from combustion processes. • Samples taken with PUF sampler, 24-hour integrated sampling at Sun Metro (481410053). • PAH levels are compared to ESLs. • Highest species concentrations Phenanthrene & Pyrene. • Method changes make trends not meaningful. • Quality objectives = 95% confidence intervals: • Detection limit (DL) variable, up to 0.4 ng/m3 • +/- 30% precision (reproducibility) • +/- 50% accuracy (% difference to standard) • 80% minimum data return per quarter
PAH Phenanthrene Comparisons Annual means Units in ng/m3 Sun Metro/QA Laredo/QA Brownsville Edinburg Mission Annual ESL: 50ng/m3 Notes: 2003 has 1st quarter only. Method change in 2003 led to higher sample recovery, thus trend not meaningful.
PAMS (Auto-GC & Carbonyl) Network Data used to understand O3 formation, track VOC, NOx EIs, trends, and nonattainment. Further: • Assess feasibility & need for long-term or extensive toxic or photochemical monitoring. • Identify & track hazardous compounds & identify sources. • Are pollutants contributing factor to health problems? • Assess temporal variations of pollutants • Track point, mobile, area, biogenic sources. • Identify trends. • Provide database to plan, develop, evaluate & diffusion models & control strategies.
Carbonyl Details • Carbonyls = oxygenated hydrocarbons C1-C9 • 24-hour integrated samples, 16 species reported • Quality objectives = 95% confidence intervals: • Detection limit (DL) 0.01-0.06 ppbV • +/- 25% precision (reproducibility) • +/- 30% accuracy (% difference to standard) • 75% minimum data return per quarter
Chamizal Carbonyl Findings • Formaldehyde (HCHO) has highest levels, followed by Acetone & Acetylene. • Levels comparable to other cities in TX. • Trends appear to be flat. • Levels below ESL. • Following graphs show results of every 6th day sampling with a moving spline fit. • Later graphs compare Chamizal to other cities.
Carbonyl every 6th day II Short-term ESL = 12 ppbV
Carbonyl every 6th day III Acetaldehyde Short-term ESL = 50 ppbV Acetone ST ESL = 2500 ppbV
Quarterly Mean HCHO in Texas Units in ppbV Houston-Clinton Dr. Houston-Deer Park Houston-Haden Rd. Houston-Channelview Fort Worth-NW El Paso-Chamizal Dallas-Hinton Dr. Long-term ESL = 1.2 ppbV
Auto-GC Details • Species = O3 precursor hydrocarbons C1-C10 • 40 min. sample each hour, 45 species reported • Quality objectives = 95% confidence intervals: • Detection limit (DL) 0.05-0.60 ppbC (note units) • +/- 20% precision (reproducibility at DL) • +/- 25% accuracy (% difference to standard) • 75% minimum data return per quarter
Auto-GC Findings • Trends for toxics (Benzene & 1,3 Butadiene appear to be downward. (RFG?) • Following graphs show annual means for B & 1,3 B. (B trend is stat. signif., 1,3 B not) • Subsequent graphs show variability by wind direction… look at ratio w Acetylene, a tracer for vehicle exhaust, see constant levels. • Conclusion: motor vehicles main source of HCs.
Auto-GC Toxics Trends 1997-2002 annual mean 1,3 Butadiene, units in ppbC 1995-2002 annual mean Benzene, units in ppbC
Mean HCs by WDR ppb-C
HCs Ratio to C2H2 Ratio Propane & Ethane from nat. gas, others from exhaust
Conclusions • Monitoring helps: • Assess human exposure to air pollutants and air toxics • Findings show some need for more attention • Assess trends related to pollution controls • Arrest concerns that may exist about potential exposures