Download
1 / 21

E N D
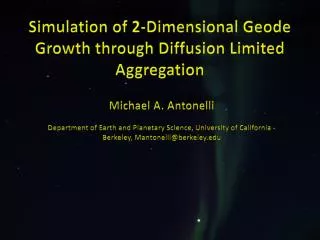
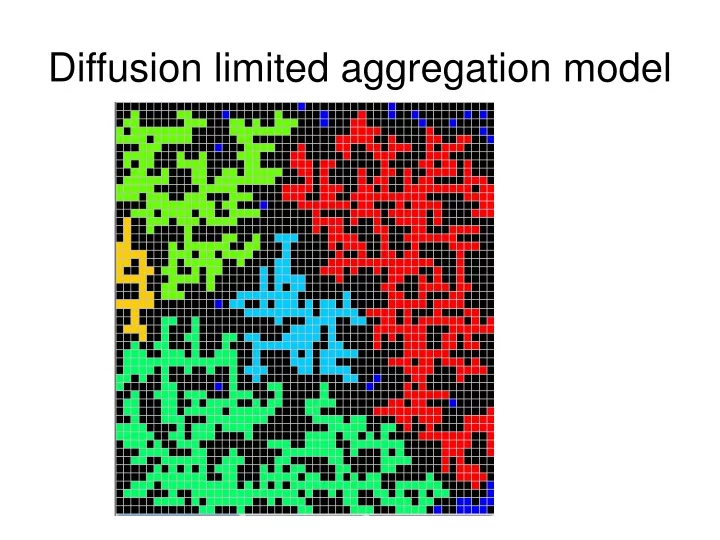
Invented in 1981 by T.A. Witten, L.M. Sander. The growth rule is remarkably simple. We start with an immobile seed on the plane. A walker is then launched from a random position far away and is allowed to diffuse. If it touches the seed, it is immobilized instantly and becomes part of the aggregate. We then launch similar walkers one-by-one and each of them stops upon hitting the cluster. After launching a few hundred particles, a cluster with intricate branch structures results.
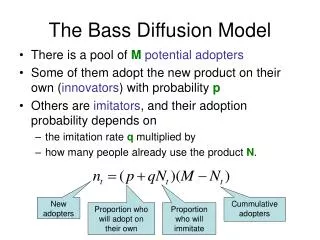
A fractal is an object that looks the same on all length scales. For example, the fractal above consists of big branches which shoot off smaller branches, which shoot off still smaller branches, and so on. A fractal is also an object which can be thought of as having a non-integer dimension. For example, suppose we measure length in units of "a" .Then in a line of length L, the number of such units that fill up the line is If we have a square with side of length L, and we measure area in units of a2, then the number of such units that fill up the square is The number of units that fill up the object is where L is the characteristic length of the object, and D is the dimension. For the fractal above, the number of units N that make up the fractal (in the DLA cluster this is just the number of attached walkers) scales as , where D ~ 1.6 is a non-integer number. For the DLA fractal 1 < D < 2 -- the fractal has greater extent than a line, as it spreads out in the plane, hence 1 < D; however it does not fill up any area uniformly - large holes are always left behind, so D < 2. D is called the fractal dimension.
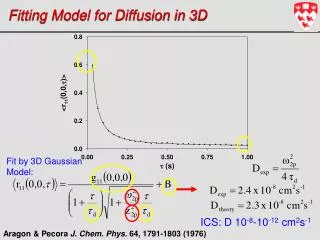
Evaluating the fractal dimension The fractal dimension of this kind of aggregates, D, is estimated from the radius of gyration, Rg, by means of a linear-fit to in a log-log plot, where k is a constant, N is the number of aggregated particles and β = 1/D. • The radius of gyration of a particular molecule at a given time is defined as:
(a) Aggregates containing N = 150 × 103 particles each, for λ = 1, 10, 100 and 1000 units, visualized at 5%, 10%, 30% and 100% of their total size. The blue squares display the multiscaling evolution of the structure. (b) Radius of gyration, Rg, and (c) fractal dimension, D, versus the number of aggregated particles, N, in log-log and lin-log plots, respectively. Notice that, when λ → ∞, the structure of the aggregates tends to MF (D = 1). Each curve was computed as an average over an ensemble of aggregates. (d) Evolution of the growing front for the first two stages of growth.
"Lichtenberg figures" are branching, tree-like patterns that are created by the passage of high voltage electrical discharges through electrically insulating materials (dielectrics).
A temporary lightning tattoo on a "lucky" survivor From "Lichtenberg Figures Due to a Lightning Strike" by Yves Domart, MD, and Emmanuel Garet, MD, New England Journal of Medicine, Volume 343:1536, November 23, 2000
Fractal patterns The bronchial tree of a human lung The satellite view of a river drainage system near Grand Junction, Colorado, USA.
To quantify better the differences in orientations and lengths of streets, within cities as well as between cities, we use the Gibbs/Shannon entropy formula, namely where S is entropy, k is a positive constant, t is the number of bins with nonzero probabilities of streets, and pi is the probability of streets falling in the i-th bin.
Power-law length distributions (inset: log-log plots and calculated tail entropies, S) for the time periods shown in d. L denotes street length in metres.