Download

1 / 73
740 likes | 901 Views
Beyond Supply and Demand: Water Use Efficiency and Sustainable Resources. Dave Todd California Department of Water Resources Office of Water Use Efficiency and Transfers.

E N D
Beyond Supply and Demand: Water Use Efficiency and Sustainable Resources Dave Todd California Department of Water Resources Office of Water Use Efficiency and Transfers
The Department of Water Resources Office of Water Use Efficiency (OWUE) provides support for the stewardship of California's water resources and energy efficient use of water.
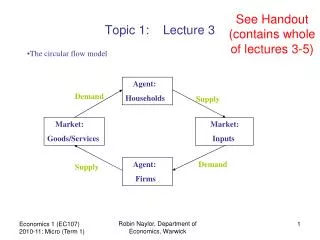
Environmental 3% 20% Urban 77% Agriculture CA Water Demand(developed water)
California’s Future Population M 34.7 Million (RAND Est.) 45.5 Million (RAND Est.) 54.8 Million (State Demographer Est.)
600,000 people and over 200,000 homes per year Impacts housing, education, transportation, energy, environment, water
California Water Supply • California’s supply of water from the Colorado River will be reduced over the next 10 years* to its legal allotment of 4.4 million acre-feet per year. • The USGS Reports the Current (7 year Colorado River) drought may be “Comparable to or More Severe than the largest know drought in 500 Years” • An undetermined amount of the state’s surface and ground water supply will not be available due to contaminants. • Groundwater in the state, with the exception of a few adjudicated basins, is unregulated and several basins are overdrafted. *2017
California Water Supply • Six years in the past 1,000 have been reconstructed as drier than the single lowest annual flow of the gauged record (1977). • The reconstruction for A. D. 1580 is only 1/3 of the 1977 flow. • It is notable that the researchers categorize short droughts as 1-6 years in length. • Based on the available evidence, researchers hypothesized century long droughts that affected the Sierra Nevada ending in the years 1112 and 1350.
California Water Supply • Global warming is also bringing new uncertainty about the reliability and timing of the precipitation and run-off that the state receives • Global climate change affect on precipitation patterns; amounts; sea level/coastal communities • From 2035 to 2064, Sierra snow pack is expected to decrease 12 to 47 percent from historic levels. By the end of the century, annual snow pack could decline by 90 percent. Source: California Climate Action Team reports
Other impacts on statewide water supply outlook • Statewide, the loss could amount to 3 million to 4 million acre-feet per year within 50 years. • That is more water than is delivered each year by the California Aqueduct, the 444-mile canal that supplies Southern California with Delta water from Byron. • By comparison, the state's share of the Colorado River is 4.4 million acre-feet.
Other impacts on statewide water supply outlook • Enforcement of salt levels in Sacramento/San Joaquin Delta • Energy costs, availability • These facts mean that water suppliers must have a plan for serving water to their customers throughout such extended droughts.
Water/Energy Connection • California’s water systems are energy-intensive • 7-8% energy use for large water systems • If consumer end use is included: • 19% of electric energy load in California • 30% of natural gas energy load in California
Water/Energy Connection • The State Water Project largest single user of energy in the state • Water conservation lowers energy use and energy bills, and is the least energy intensive source of potential supply, along with water recycling
Water/Energy Connection, con’t. • The State Water Project is the largest single user of energy in the state • Water conservation lowers energy use and energy bills and along with water recycling, is the least energy intensive source of potential supply
Water/Energy Connection, con’t. • This energy consumption results in approximately 44 million tons of CO2 emissions each year (equal to approximately 9% of total state emissions in 2002), primarily from: (1) fossil fuel-based electricity generation; and (2) natural gas combustion. • If California were to reduce urban water use by 2.1 million acre feet, it could result in a savings of approximately 6,500 GWh of electricity,
Water Use Efficiency Works • 1980 – California Agriculture Produced 1.5 tons of crops per acre-foot of water applied • 2000 – Growers Produced 2.3 tons of crops per acre-foot of water applied – a 50% increase • 2003 – SDCWA Reports Consumption Up Less Than 1% Since 1990 With a 16% Population Increase • Bay Area Water Agencies Coalition Reports Residential Consumption Increased by 3% With a 17% Population Increase (Total Use Decreased 1%)
Water Use Efficiency Works • The California Water Plan Update 2005 estimates that there is additional annual water demand reduction of up to 800,000 acre feet from Agricultural Water Use Efficiency (Net) and 3.1 million acre feet from Urban Water Use Efficiency (Applied). • The estimated cost for Ag Water Use Efficiency ranges from $300 - $4.0 billion. • The estimated cost for Urban Water Use Efficiency ranges from $2.5 - $6.0 billion.
Water Use Efficiency Works • Kern County Water Agency reported an 8 percent improvement in irrigation efficiency from 1976 to 1986. • Total applied water use in the San Joaquin Valley portion of Kern County was reduced by about 250,000 acre-feet – enough water to irrigate about 70,000 acre feet.
Water Use Efficiency Works • Since 1986 Kern County has added 61,000 acres of trees and vines. Nearly all of this new crop area has low volume drip irrigation systems installed. • KCWA estimates the overall on-farm water use efficiency is about 78% (the remaining 22% constitutes leaching requirement, irrigation system distribution non-uniformity, and recoverable and/or irrecoverable flows.
Water Use Efficiency Works • Financial Assistance • $12 million in 2001 • $10 million in 2002 • $18 million in 2003 • $28 million in 2005 • 750,000 acre feet - anticipated savings for 92 local projects • Prop 50 $35 million this year for Water Use Efficiency (Ag & urban) and $30 million in the next funding round • Prop 50 $50 million each year for Desalination over the next 2 years
Water Use Efficiency Works • The California Water Plan Update (Bulletin160-05) estimates water use efficiency can reduce urban water use by 1.1 to 2.3 MAF per year and agricultural water by 0.5 to 2.0 MAF per year by 2030. • Accelerating the investment to attain that water use savings by 2015 would result in an estimated additional GHG reduction of approximately 30 million tons by 2030.
Water Use Efficiency Works • The California Bay-Delta Authority’s larger estimated potential for 3.0 MAF per year urban water use reduction requires a greater rate of local and state/federal investment in conservation. Incentive driven advances in water-saving technology over the next 25 years potentially could further push savings beyond the levels indicated.
Urban Water Management Plans – As a Foundation for SB 610 Assessments and SB 221 Verifications What you always wanted to know but were afraid to ask about documenting water supply reliability
DWR Published “Guidebook for Implementation of Senate Bill 610 and Senate Bill 221 of 2001” • The SB 610/SB 221 Guidebook and Frequently Asked Questions are available on the Office of Water Use Efficiency & Transfers web site at: www.owue.water.ca.gov
SB 610 • Improve the link between information on water supply availability and certain land use decisions made by cities & counties • Promote more collaborative planning between local water suppliers and cities & counties
SB 610 • Requires detailed information regarding water availability be provided to city or county decision-makers prior to approval of specified large development projects • Recognize local control and decision making regarding the availability of water for projects and the approval of projects
SB 221 • Subdivision Map Act now requires local governments to impose on all tentative subdivision maps subject to SB 221 the condition that there be sufficient water for the project along with existing and planned uses. • This condition is met by a verification.
SB 221 • The verification must in any event be supported by substantial evidence. • A final map may not be filed if the condition has not been met.
Why was SB 901 replaced by SB 610 and SB 221? “Real” Water Supplies Needed to Serve New Development Were Not Identified
SB 901: Integration of Water Supply Assessment into the Land Use Planning Process SB 901 was landmark legislation to link land use and water supply planning processes to ensure that land use and water supply agencies would communicate early in the planning process: • Ensured that cities and counties retain authority over land use decisions. • Established a “full disclosure” process regarding water supply availability. • Required water utilities to calculate multiple dry-year water supplies and provide this information at the general or specific plan stage. • Required water utilities and land use agencies to consider impacts upon existing users during multiple dry water years.
SB 610 SB 610 Was Designed to Improve Performance By: • Closing the “loopholes” that permitted many large-scale projects to avoid the SB 901 water supply assessment • Requiring more detailed information be included in local water supply assessments • Expanding the informational requirements for projects proposing to use groundwater
SB 610 • SB 610 requires land use agencies to include substantive information about water supply for large projects to be included in their CEQA document • SB 610 requires the water supplier to prepare Water Supply Assessments that include information on long term demand & supply
SB 221 (Kuehl) • Subdivision Map Act now requires local governments to impose on all tentative subdivision maps subject to SB 221 the condition that there be sufficient water for the project along with existing and planned future uses. • This condition is met by a verification. • The verification must be supported by substantial evidence. • A final map may not be filed if the condition has not been met.
The 2005 Urban Water Management Plan -Background • 17 Amendments • Required by California Water Code § 10610 -10657 • Due in years ending in 0 and 5 • Applies to urban water suppliers serving more than 3,000 customers or more than 3,000 acre feet of water per year
The 2005 Urban Water Management Plan -Background • DWR has no regulatory, permitting or enforcement authority – provides technical assistance • DWR reviews UWMP topics for completeness • Published 2005 UWMP Guidebook • Guidebook content is what is in the law (2030 projection for SB 610/SB 221 optional) • DWR UWMP Review Sheets available to suppliers to assist in Plan preparation
Urban Water Management Plans Legislation: 2000-Present Act Established: AB 797 Klehs, 1983 Changes in the UWMP Act Since 2000: • SB 610, Costa, 2001 – Land & water use planning, groundwater information, reliability, sustainability, UWMP as foundational document for Water Supply Assessment
Urban Water Management Plans Legislation: 2000-Present • AB 901, Daucher, 2001 – Water Quality Info • SB 672, Machado, 2001 – Minimize Need to Import Water • SB 1348 Brulte, 2002 – Consider DMM Implementation When Evaluating Eligibility
Urban Water Management Plans Legislation: 2000-Present • SB 1384 Costa, 2002 - Wholesale agency water supply information • SB 1518 Torlakson, 2002 - Recycled Water • AB 105 Wiggins, 2004 - Deposit UWMPs in State library • SB 318, Alpert, 2004 - Desalination
Urban Water Management Plans and the Courts - Risks • UWMPs are subject to legal challenge • Inadequate planning = Increased risk exposure • Negative court decisions cost the agency, developers, and the community time, trust and money
Urban Water Management Plans & the Courts - Community Involvement Community involvement: • Can discuss issues and work to resolve problems • Putting everything on the table at the start can help forestall unnecessary conflicts • It’s still possible that public interest groups, agencies, or other participants will be disagree
Urban Water Management Plans & the Courts - Community Involvement Community involvement: • Reasonable people may still have disagreements, but if your plan is challenged in court, you know the issues, bring a history of working for resolution, and are better prepared
Urban Water Management Plans & the Courts - Community Involvement Community involvement: • Inclusive process • Hard to get participation – some public interest groups have no paid staff • No response to an ad in the paper is not a defense in court
Summary of Best Management Practices - 1996 UWMP Report to the Legislature • BMP Best Management Practices Implementing Not Implementing Total • 1 Interior and Exterior Water Audits for Single Family and Multi-Family Customers 165 150 315 • 2 New and Retrofit Plumbing 238 77 315 • 3 Distribution System Water Audits, Leak Detection and Repair 211 104 315 • 4 Metering with Commodity Rates 265 50 315 • 5 Large Landscapes and Water Audits and Incentives 144 171 315 • 6 Landscape Water Conservation 200 115 315 • 7 Public Information 295 20 315 • 8 School Education 260 55 315
BMP Best Management Practices Implementing Not Imp. • Commercial and Industrial Water Conservation • 140 175 315 • New Commercial, Industrial and Institutional Water Use Review 147 168 315 • Conservation Pricing • 205 110 315 • Landscape Water Conservation for New and Existing Single Family Homes 193 122 315 • Water Waste Prohibition • 229 86 315 • Water Conservation Coordinator • 224 91 315 • Financial Incentives • 120 195 315 • Ultra-Low Flush Toilet Replacement • 179 136 315 • Implementation - Reported can be any level of implementation, or another agency is implementing this BMP. Implementation - Not Reported could mean that there is an exemption, the BMP is not applicable, or the agency is not implementing the BMP.
Urban Water Management Plans - Consequences of Not Doing a Plan • DWR is prevented from providing funding • Insufficient dry year & emergency planning • Documentation is still needed anyway for SB 610/SB 221 Assessments/Verifications if area plans approval of large scale developments (water use equivalent to over 500 dwelling units)
Urban Water Management Plans - Litigation Exposure UWMP Litigation can be based on: • Failure to adopt a plan - WC § 10650(a) • Failure of the UWMP, or action taken pursuant to the Plan, to comply with requirements of the law – WC § 10650(b) • Abuse of discretion - established if the supplier has not proceeded as required by law, or if the action is not supported by substantial evidence – WC § 10651
Urban Water Management Plans - New Requirements Reliability Information: • Must be provided for each water source • 20 year supply/demand projection required • 25 year projection optional – recommended for SB 610/SB 221 water supply assessment/verification
Urban Water Management Plans - The Bottom Line • Serve as a foundational document for an Integrated Regional Water Management Plan • Serve as a foundational document for SB 610/SB 221 Assessment/Verification • Position the community to get State funding as it becomes available