Download
1 / 54
540 likes | 723 Views
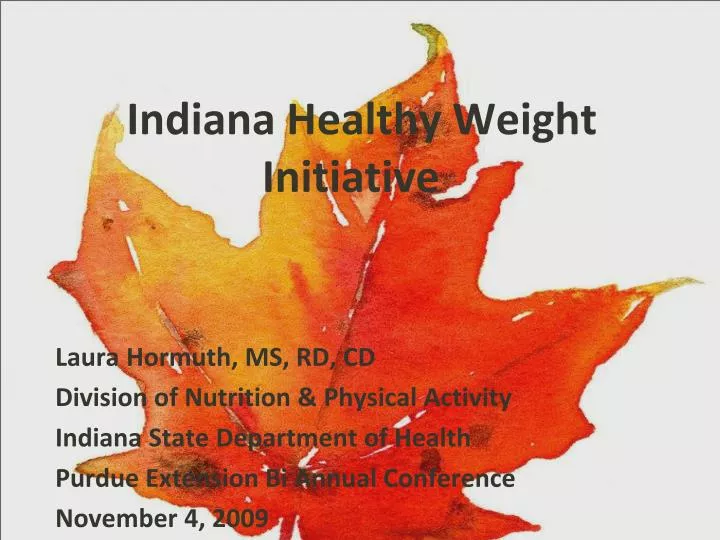
Indiana Healthy Weight Initiative. Laura Hormuth, MS, RD, CD Division of Nutrition & Physical Activity Indiana State Department of Health Purdue Extension Bi Annual Conference November 4, 2009. Presentation Outline. The new State Indicator Report on Fruits and Vegetables, 2009

E N D
Indiana Healthy Weight Initiative Laura Hormuth, MS, RD, CD Division of Nutrition & Physical Activity Indiana State Department of Health Purdue Extension Bi Annual Conference November 4, 2009
Presentation Outline • The new State Indicator Report on Fruits and Vegetables, 2009 • Fruits & Veggies—More Matters logo and Website video center • The Indiana Healthy Weight Initiative
Objectives for Today • You will know where to find Indiana data on Fruits and Vegetable consumption and policy and environmental support • You will understand how to use the videocenter on the Fruits & Veggies—More Matters Website • Learn what Indiana is doing to improve the health and weight of Indiana residents through the Indiana Healthy Weight Initiative
NEW State Indicator Report on Fruits and Vegetables, 2009 http://www.fruitsandveggiesmatter.gov/health_professionals/statereport.html
Fruits & Veggies—More Matters http://www.fruitsandveggiesmorematters.org/
Obesity Trends* Among U.S. AdultsBRFSS, 1985 (*BMI ≥30, or ~ 30 lbs. overweight for 5’ 4” person) No Data <10% 10%–14% Source: http://www.cdc.gov/obesity/data/trends.html; retrieved 10-1-09
Obesity Trends* Among U.S. AdultsBRFSS, 1986 (*BMI ≥30, or ~ 30 lbs. overweight for 5’ 4” person) No Data <10% 10%–14% Source: http://www.cdc.gov/obesity/data/trends.html; retrieved 10-1-09
Obesity Trends* Among U.S. AdultsBRFSS, 1987 (*BMI ≥30, or ~ 30 lbs. overweight for 5’ 4” person) No Data <10% 10%–14% Source: http://www.cdc.gov/obesity/data/trends.html; retrieved 10-1-09
Obesity Trends* Among U.S. AdultsBRFSS, 1988 (*BMI ≥30, or ~ 30 lbs. overweight for 5’ 4” person) No Data <10% 10%–14%
Obesity Trends* Among U.S. AdultsBRFSS, 1989 (*BMI ≥30, or ~ 30 lbs. overweight for 5’ 4” person) No Data <10% 10%–14%
Obesity Trends* Among U.S. AdultsBRFSS, 1990 (*BMI ≥30, or ~ 30 lbs. overweight for 5’ 4” person) No Data <10% 10%–14% Source: http://www.cdc.gov/obesity/data/trends.html; retrieved 10-1-09
Obesity Trends* Among U.S. AdultsBRFSS, 1991 (*BMI ≥30, or ~ 30 lbs. overweight for 5’ 4” person) No Data <10% 10%–14% 15%–19% Source: http://www.cdc.gov/obesity/data/trends.html; retrieved 10-1-09
Obesity Trends* Among U.S. AdultsBRFSS, 1992 (*BMI ≥30, or ~ 30 lbs. overweight for 5’ 4” person) No Data <10% 10%–14% 15%–19% Source: http://www.cdc.gov/obesity/data/trends.html; retrieved 10-1-09
Obesity Trends* Among U.S. AdultsBRFSS, 1993 (*BMI ≥30, or ~ 30 lbs. overweight for 5’ 4” person) No Data <10% 10%–14% 15%–19% Source: http://www.cdc.gov/obesity/data/trends.html; retrieved 10-1-09
Obesity Trends* Among U.S. AdultsBRFSS, 1994 (*BMI ≥30, or ~ 30 lbs. overweight for 5’ 4” person) No Data <10% 10%–14% 15%–19% Source: http://www.cdc.gov/obesity/data/trends.html; retrieved 10-1-09
Obesity Trends* Among U.S. AdultsBRFSS, 1995 (*BMI ≥30, or ~ 30 lbs. overweight for 5’ 4” person) No Data <10% 10%–14% 15%–19% Source: http://www.cdc.gov/obesity/data/trends.html; retrieved 10-1-09
Obesity Trends* Among U.S. AdultsBRFSS, 1996 (*BMI ≥30, or ~ 30 lbs. overweight for 5’ 4” person) No Data <10% 10%–14% 15%–19% Source: http://www.cdc.gov/obesity/data/trends.html; retrieved 10-1-09
Obesity Trends* Among U.S. AdultsBRFSS, 1997 (*BMI ≥30, or ~ 30 lbs. overweight for 5’ 4” person) No Data <10% 10%–14% 15%–19% ≥20% Source: http://www.cdc.gov/obesity/data/trends.html; retrieved 10-1-09
Obesity Trends* Among U.S. AdultsBRFSS, 1998 (*BMI ≥30, or ~ 30 lbs. overweight for 5’ 4” person) No Data <10% 10%–14% 15%–19% ≥20% Source: http://www.cdc.gov/obesity/data/trends.html; retrieved 10-1-09
Obesity Trends* Among U.S. AdultsBRFSS, 1999 (*BMI ≥30, or ~ 30 lbs. overweight for 5’ 4” person) No Data <10% 10%–14% 15%–19% ≥20% Source: http://www.cdc.gov/obesity/data/trends.html; retrieved 10-1-09
Obesity Trends* Among U.S. AdultsBRFSS, 2000 (*BMI ≥30, or ~ 30 lbs. overweight for 5’ 4” person) No Data <10% 10%–14% 15%–19% ≥20% Source: http://www.cdc.gov/obesity/data/trends.html; retrieved 10-1-09
Obesity Trends* Among U.S. AdultsBRFSS, 2001 (*BMI ≥30, or ~ 30 lbs. overweight for 5’ 4” person) No Data <10% 10%–14% 15%–19% 20%–24% ≥25% Source: http://www.cdc.gov/obesity/data/trends.html; retrieved 10-1-09
Obesity Trends* Among U.S. AdultsBRFSS, 2002 (*BMI ≥30, or ~ 30 lbs. overweight for 5’ 4” person) No Data <10% 10%–14% 15%–19% 20%–24% ≥25% Source: http://www.cdc.gov/obesity/data/trends.html; retrieved 10-1-09
Obesity Trends* Among U.S. AdultsBRFSS, 2003 (*BMI ≥30, or ~ 30 lbs. overweight for 5’ 4” person) No Data <10% 10%–14% 15%–19% 20%–24% ≥25% Source: http://www.cdc.gov/obesity/data/trends.html; retrieved 10-1-09
Obesity Trends* Among U.S. AdultsBRFSS, 2004 (*BMI ≥30, or ~ 30 lbs. overweight for 5’ 4” person) No Data <10% 10%–14% 15%–19% 20%–24% ≥25% Source: http://www.cdc.gov/obesity/data/trends.html; retrieved 10-1-09
Obesity Trends* Among U.S. AdultsBRFSS, 2005 (*BMI ≥30, or ~ 30 lbs. overweight for 5’ 4” person) No Data <10% 10%–14% 15%–19% 20%–24% 25%–29% ≥30% Source: http://www.cdc.gov/obesity/data/trends.html; retrieved 10-1-09
Obesity Trends* Among U.S. AdultsBRFSS, 2006 (*BMI ≥30, or ~ 30 lbs. overweight for 5’ 4” person) No Data <10% 10%–14% 15%–19% 20%–24% 25%–29% ≥30% Source: http://www.cdc.gov/obesity/data/trends.html; retrieved 10-1-09
Obesity Trends* Among U.S. AdultsBRFSS, 2007 (*BMI ≥30, or ~ 30 lbs. overweight for 5’ 4” person) No Data <10% 10%–14% 15%–19% 20%–24% 25%–29% ≥30% Source: http://www.cdc.gov/obesity/data/trends.html; retrieved 10-1-09
Obesity Trends* Among U.S. AdultsBRFSS, 2008 (*BMI ≥30, or ~ 30 lbs. overweight for 5’ 4” person) No Data <10% 10%–14% 15%–19% 20%–24% 25%–29% ≥30% Source: http://www.cdc.gov/obesity/data/trends.html; retrieved 10-1-09
% of IN Adults who Self-Report Being at a Normal Weight, 1990-2008 Only 36% of IN adults reported being a normal weight in 2008 53% of IN adults report being a normal weight in 1990 Source: Indiana BRFSS Data, 1990-2008
% of IN Adults who self-reported being either overweight or obese, 1990-2008 In 2008, 64% of IN adults reported being either or overweight/obese. Source: Indiana BRFSS Data, 1990-2008
% of Indiana Adults who Self-Report being Overweight or Obese, 1990-2008 27% 37% Source: Indiana BRFSS Data, 1990-2008
Current State • 64 % of Indiana adults are considered overweight or obese (BRFSS) • 29 % of Indiana High School students are considered overweight or obese (YRBS) • Of Indiana children 2-4 participating in WIC, 31% are overweight or obese (PedNSS)
How did this happen? endless sugary drink options unsafe neighborhoods CHEAP processed, high energy dense foods roads without sidewalks portion distortion cul-de-sacs explosion of restaurants changing family unit building design automobile only access working parents lack of access to healthy food schools outside neighborhoods family dinners? transportation TV, computers, video games stair access? high traffic – 4-5 lane intersections 24/7 fast food lack of access to places to be physically active roads without bike lanes
The Purpose The purpose of the Indiana Healthy Weight Initiative is to improve healthy eating and physical activity to prevent and control overweight and obesity and other chronic diseases among Indiana residents
Six Priority Areas • Increased physical activity • Increased consumption of fruits and vegetables • Increased breastfeeding (initiation, duration, and exclusivity) • Decreased consumption of high energy-dense foods (e.g., candy, chips, cookies) • Decreased consumption of sugar-sweetened beverages • Decreased television/screen time
Initiatives Activities The activities include: • Plan, implement and evaluate a state plan for encouraging healthy weight • Organize and maintain a task force of statewide partners • Build and sustain statewide capacity for addressing overweight and obesity
Initiative’s Progress to Date • Added staff to the DNPA • Organized a task force with 8 workgroups that meet monthly/bimonthly • Created a Website www.inhealthyweight.org • Vision, Mission and Goals have been approved by the CDC • Workgroups are currently working on objectives
Indiana State Department of HealthDivision of Nutrition and Physical Activity Ellen Whitt, JD Director ewhitt@isdh.in.gov, (317) 232-1200 Schools: Juliana Hammer, MPH, C.H.E.S. jhammer@isdh.in.gov, (317) 233-5588 Nutrition, Breastfeeding & Faith-Based Initiatives: Laura Hormuth, MS, RD, CD lhormuth@isdh.in.gov, (317) 234-3498 Data and Research: Amanda Raftery, MPH, RD, CD araftery@isdh.in.gov, (317) 234-3798 Physical Activity & Older Adults: Mike Lindbloom, MS mlindbloom@isdh.in.gov, (317) 234-3580 Communities & Early Childhood: Marcie Memmer, MPH, C.H.E.S. mmemmer@isdh.in.gov, (317) 233-7726 Worksite Wellness: Jamie Delaney jadelaney@isdh.in.gov, (317) 234-2923
Task Force Membership • State-wide organizations with a stake in obesity prevention • 148 individuals • 83 organizations
Task Force Workgroups • Breastfeeding • Communities • Early Childhood/Childcare • Faith-Based • Healthcare • Schools • Older Adults • Worksites Organization • 8 workgroups – including the school setting • 2 advisory committees • 1 steering committee
Indiana Healthy Weight Initiative Vision All Hoosiers practice and enjoy a lifestyle of healthy eating and physical activity within an environment that supports health, wellness and vitality. Mission To enhance the health and quality of life of Hoosiers by promoting good nutrition, regular physical activity and a healthy weight through policy, environment and lifestyle change.
State Plan: Overarching Goals • Increase access to and consumption of healthy foods and beverages. • Increase opportunities for and engagement in regular physical activity. • Increase efforts aimed at achieving a healthy weight. • Reduce disparities related to breastfeeding, nutrition, physical activity, overweight, obesity, and chronic diseases. • Increase the capacity of communities and settings to develop and sustain a healthy lifestyle and culture. • Increase strategic partnerships to share resources, identify and reach priority populations, and increase capacity to prevent and control obesity and chronic diseases.
Current Recommendations for Interventions • Population-based approaches affecting a large # of different populations simultaneously • Must be sustainable Policy Systems Environment