Download
1 / 74
740 likes | 754 Views
ASOS Wind Sensor. The current ASOS wind sensor, the Belfort 2000, uses rotating cups to measure wind speed and a vane to measure wind direction. Over a two-minute period ASOS uses 24 five-second averages to determine the two-minute average wind speed and direction.

E N D
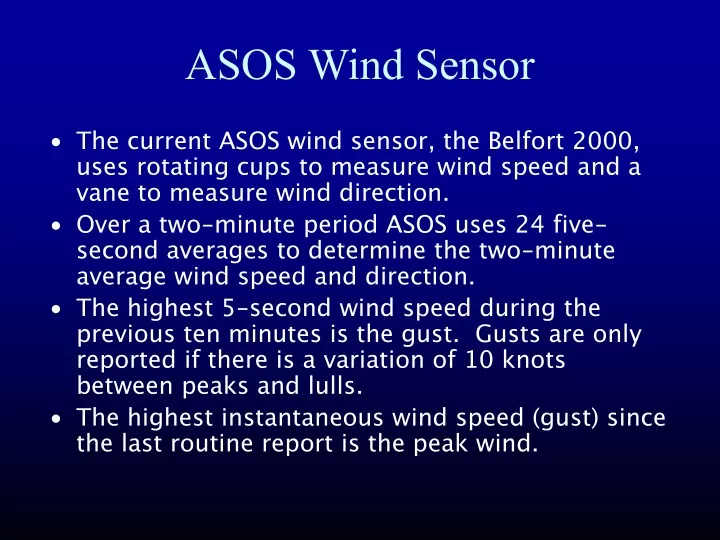
ASOS Wind Sensor • The current ASOS wind sensor, the Belfort 2000, uses rotating cups to measure wind speed and a vane to measure wind direction. • Over a two-minute period ASOS uses 24 five-second averages to determine the two-minute average wind speed and direction. • The highest 5-second wind speed during the previous ten minutes is the gust. Gusts are only reported if there is a variation of 10 knots between peaks and lulls. • The highest instantaneous wind speed (gust) since the last routine report is the peak wind.
New Old
The New Wind Sensor • The new ASOS wind sensor, the Vaisala 425NWS, is a sonic anemometer. It has no moving parts and is designed to operate better in winter weather conditions. • As with the Belfort sensor, over a two-minute period, ASOS uses 24 five-second averages to determine the two-minute average wind speed and direction. But the highest three-second running average speed is stored for gust and peak wind processing. • Installation has started. • The new sensor will be more responsive to short-term gusts. Can expect to see more gusts and peak winds reported with the new sensor.
Wind Observations • Major issue is representativeness • Surface winds are highly variable due to varying surface characteristics and obstacles. • Wind varies substantially with height and not all sensors are at similar elevations about the ground.
Danger of Using Model Output Directly • Lack of resolution..means larger scale models (e.g., GFS) can’t accurately define and predict local winds forced by mesoscale features…terrain, diurnal circulations. This is getting better. • Physics problems and particularly PBL parameterization issues. MM5 and most other mesoscale models tend to overmix winds in the vertical…particularly under stable conditions--results in excessive winds. Winds generally too geostrophic • Large scale model errors…from poor initializations and other causes.
The Venturi Effect is still used in some introductory texts to explain gap flow! Gap Flow 101 - Misleading the Next Generation!
Gap Flow 101 - Basics • 1-D horizontal momentum Equation: • Assume steady state, neglect Coriolis and friction and integrate: • This is simply a form of Bernoulli’s equation. Assuming steady state and no friction:
Gap Flow 101 - Basics • Provides an upper limit to maximum speed at the end of the gap • Commonly used in work from the early 1980’s • E.g. Walter and Overland (1981), Reed (1981) • Over simplification. • Gap winds are a boundary layer phenomena • Must account for drag (both surface drag and drag at the inversion)
Gap Flow 101 - Basics • Reintroduce friction (bulk aerodynamic form) • Shown to produce a much closer correlation to observed winds • E.g. Lackmann and Overland (1989), Mass et al (1995), Colle and Mass (1986), Bond and Stabeno (1998) • Predicted by Overland’s (1984) scale analysis • Assumptions: • No elevation change along the gap (though this can be accounted for relatively easily) • Flow eventually accelerates so that balance develops between friction and pressure gradient force.
Gap Exit • The strongest winds are generally in the gap exit region.
Strait of Juan de Fuca is well known for its easterly gales in the gap exit region.
Max Winds, 28 Dec. 1990 Fraser River NE Gap Flow > 40 ms-1
Near Sea Level Gap On Border of WA and OR
36 km grid spacing 12 km grid spacing The Dalles Portland Portland The Dalles Pass Height = 700 m Pass Height = 600 m
4 km grid spacing Portland Cascade Locks The Dalles The Dalles Portland Pass Height = 400 m 12 km grid spacing Pass Height = 600 m
• Portland Cascade Locks The Dalles Troutdale 1.33 km grid spacing, Pass Height = 150 m
Portland Troutdale Cascade Locks 444.4 m grid spacing, Pass Height = 100 m
Portland Troutdale T on150 mSurface
Vertical Structure • Strongest winds near exit • Hydraulic effects are important
Gap Winds in the Real World • Strongest winds tend to be in exit region because of hydraulic collapse and because of larger scale pressure gradient. • There can be some venturi acceleration in narrow regions…but that tends to be secondary.
Mesoscale Pressure and Wind Perturbations on Mesoscale Terrain Barriers • A controlling parameter is the Froude number: FR = U hN where U is the speed, h is the height of the barrier, and N is stability (Brunt-Vaisalla freq) Large FR is associated with flow going up and over terrain (large vertical excursions), small FR with flow being deflected around (quasi-horizontal flow)
Mesoscale Pressure Perturbations Sea Level Pressure
February 13 1979: The Hood Canal Storm
Winds over 100 kts destroyed the Hood Canal Bridge Cost to replace: over 100 million dollars
2-minute average July-August winds along the Northwest coast.